In traditional programming languages like C and C++, developers are responsible for allocating and freeing memory manually. This often leads to memory leaks, dangling pointers, and crashes. Java solves this with Garbage Collection (GC), an automatic memory management system built into the Java Virtual Machine (JVM).
In this tutorial, we’ll explore what garbage collection is, why it’s necessary, and how it works in the JVM.
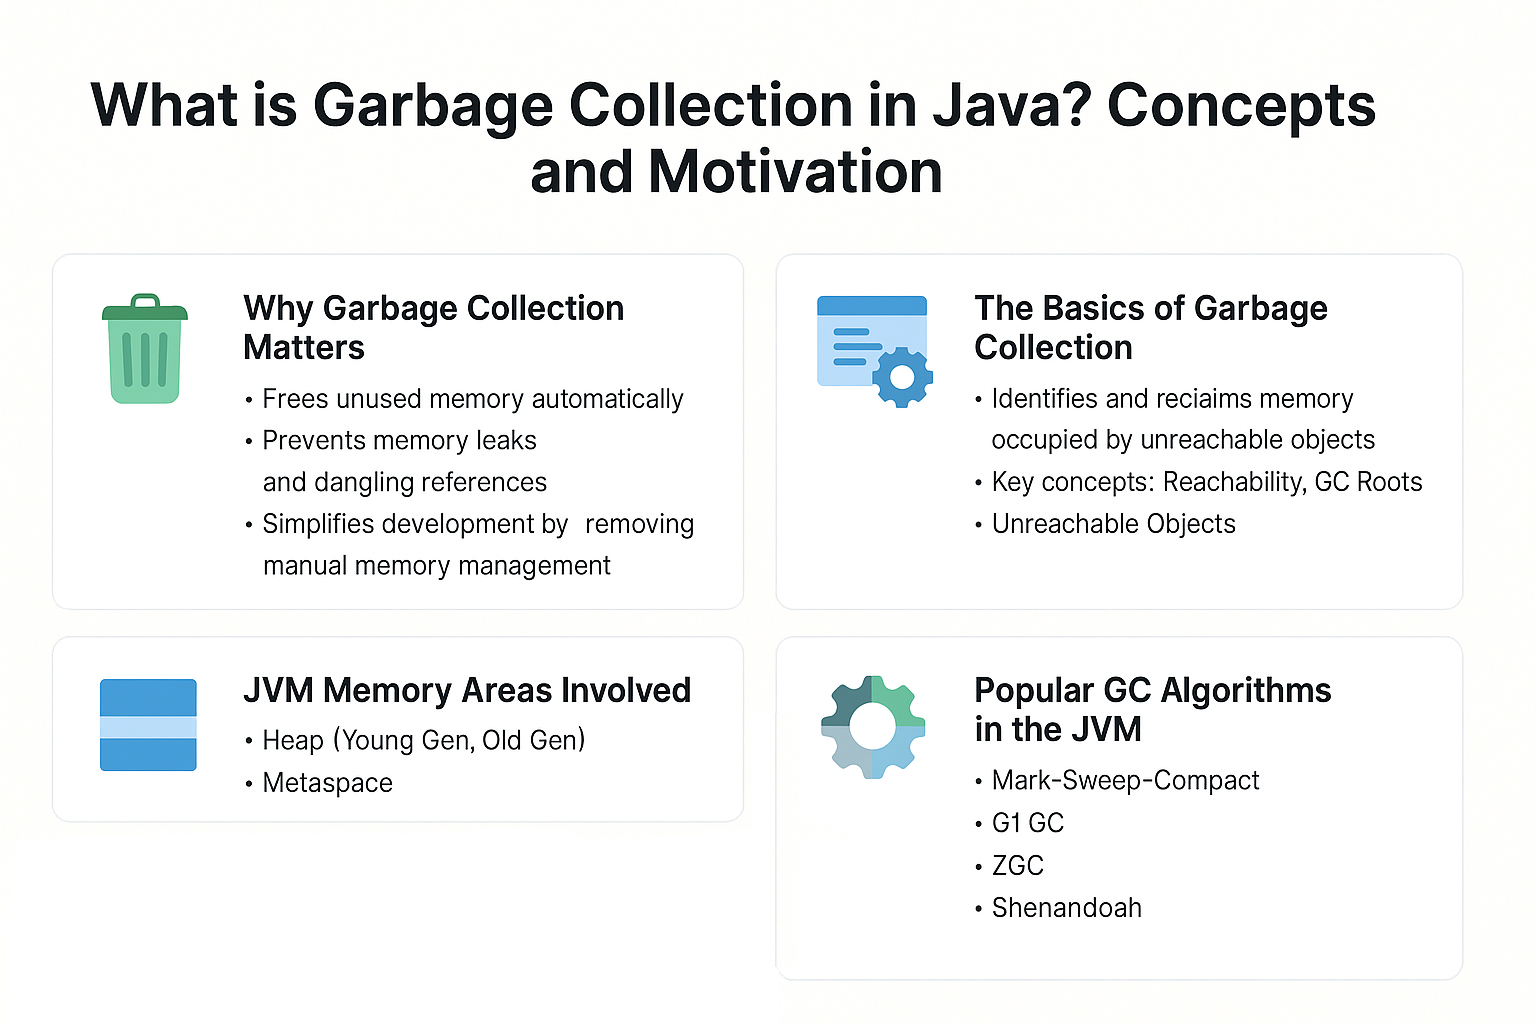
Why Garbage Collection Matters
- Frees unused memory automatically.
- Prevents memory leaks and dangling references.
- Simplifies development by removing manual memory management.
- Enables safer and more reliable applications.
Analogy: Think of GC as a janitor in an office. Employees (programs) focus on work, while the janitor (GC) cleans up unused papers (objects) to free space.
The Basics of Garbage Collection
Garbage Collection is the process of automatically identifying and reclaiming memory occupied by unreachable objects.
Key Concepts
- Reachability → If an object is reachable from a GC root, it’s considered alive.
- GC Roots include:
- Local variables in stack frames
- Static fields
- Active threads
- Unreachable Objects → Marked for collection.
Example
public class GarbageDemo {
    public static void main(String[] args) {
        String s1 = new String("Hello");
        s1 = null; // Object becomes unreachable
        System.gc(); // Suggest GC (not guaranteed)
    }
}
Here, "Hello" is eligible for GC once the reference is lost.
JVM Memory Areas Involved
- Heap → Primary GC-managed area (Young Gen, Old Gen).
- Young Generation → For short-lived objects.
- Old Generation (Tenured) → For long-lived objects.
- Metaspace → Class metadata, not GC-heavy but still important.
Generational Garbage Collection
Modern GCs divide heap memory into generations:
- Young Generation (Eden + Survivor spaces) → Frequent, fast collections (Minor GC).
- Old Generation → Less frequent but more expensive (Major GC).
- Metaspace → Class unloading.
This design optimizes for the fact that most objects die young.
Popular GC Algorithms in the JVM
1. Mark-Sweep-Compact
- Marks live objects.
- Sweeps dead objects.
- Compacts memory to remove fragmentation.
2. CMS (Concurrent Mark-Sweep)
- Concurrent, low-pause collector.
- Deprecated in Java 14.
3. G1 GC (Garbage-First)
- Region-based, default since Java 9.
- Balances throughput and low latency.
4. ZGC
- Ultra-low latency.
- Handles heaps up to multi-terabytes.
- Available in Java 11+, production-ready in Java 15.
5. Shenandoah
- Concurrent, low-pause GC from Red Hat.
- Optimized for responsiveness.
GC Tuning Basics
-Xms<size>→ Initial heap size.-Xmx<size>→ Maximum heap size.-XX:+UseG1GC→ Enable G1 GC.-XX:+PrintGCDetails→ Log GC activity.
Pitfalls and Troubleshooting
- OutOfMemoryError → When GC cannot free enough memory.
- Long GC Pauses → Cause application latency spikes.
- Memory leaks → Objects unintentionally held by references.
- Stop-the-World events → All threads pause for GC.
Real-World Case Study
A trading system running Java experienced long latency spikes due to full GCs. By switching from Parallel GC to ZGC, pause times reduced from hundreds of milliseconds to under 10ms, improving throughput and responsiveness.
Monitoring Garbage Collection
- Java Flight Recorder (JFR) → Low-overhead monitoring.
- Java Mission Control (JMC) → Visualize GC activity.
- VisualVM → Heap dump analysis.
- jcmd → Native memory reporting.
JVM Version Tracker
- Java 8 → Parallel GC default, CMS widely used.
- Java 9 → G1 GC became default.
- Java 11 → ZGC and Epsilon (no-op GC) introduced.
- Java 17 → ZGC and Shenandoah stable.
- Java 21+ → Project Lilliput reduces object header size, improving GC efficiency.
Best Practices
- Choose GC algorithm based on workload (throughput vs latency).
- Tune heap sizes based on profiling, not guesswork.
- Avoid holding references unnecessarily.
- Use
try-with-resourcesfor timely cleanup. - Monitor GC behavior in containerized environments (Docker, Kubernetes).
Conclusion & Key Takeaways
- Garbage Collection automatically manages memory in Java.
- Based on reachability analysis from GC roots.
- Different collectors balance throughput vs latency.
- Modern GCs (ZGC, Shenandoah) minimize pause times.
- Monitoring and tuning GC is essential for production-ready applications.
FAQs
1. What is the JVM memory model and why does it matter?
It defines how memory is managed across threads, ensuring safety and consistency.
2. How does G1 GC differ from CMS?
G1 is region-based and compacting, CMS had fragmentation issues.
3. When should I use ZGC or Shenandoah?
When ultra-low latency is required in large heap applications.
4. What are JVM safepoints?
Moments when threads pause for GC or JIT tasks.
5. How do I solve OutOfMemoryError in production?
Increase heap, tune GC flags, fix leaks, and analyze heap dumps.
6. What are the trade-offs of throughput vs latency?
Throughput maximizes work done, latency minimizes pause impact.
7. How do I read and interpret GC logs?
Enable logging flags and use tools like GCViewer or JMC.
8. How does JIT interact with GC?
JIT optimizations reduce object allocation, lowering GC pressure.
9. What’s new in Java 21 GC?
Project Lilliput reduces object header size for efficiency.
10. How does GC differ in microservices vs monoliths?
Microservices focus on startup and latency; monoliths optimize throughput.
