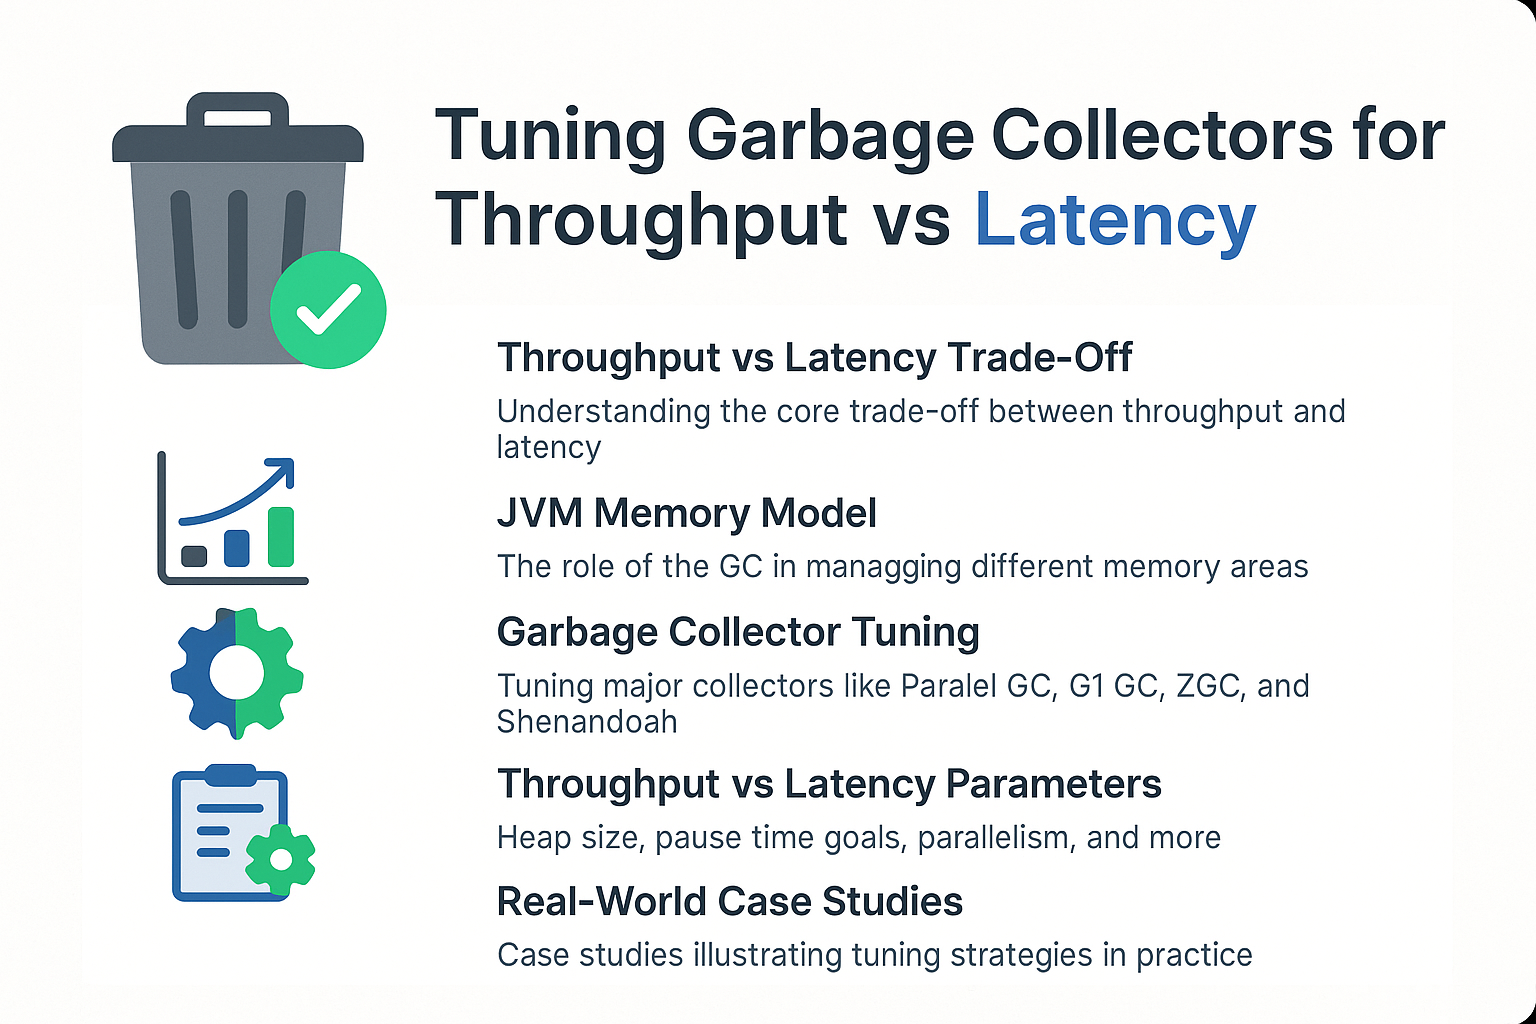
Every Java developer eventually faces the question: Should I optimize my application for maximum throughput or for minimum latency?
The Garbage Collector (GC) plays a critical role in this decision. Some GC algorithms are designed to maximize raw throughput, handling large volumes of work at the expense of occasional long pauses. Others are engineered for low-latency, minimizing pause times but with some throughput overhead.
This tutorial explores the trade-offs of throughput vs latency, how different GC algorithms support each goal, and how to tune them for your workload.
Throughput vs Latency: The Core Trade-Off
Throughput-Oriented GC
- Goal: Maximize the percentage of time spent doing actual work vs GC.
- Tolerates longer pauses if overall processing is faster.
- Best for batch jobs, data processing, and monolithic apps.
Latency-Oriented GC
- Goal: Minimize pause times for predictable response times.
- Accepts slightly lower throughput for consistency.
- Best for real-time trading, gaming servers, and microservices.
Analogy:
- Throughput tuning is like a cargo ship—efficient at moving lots of goods but slow to maneuver.
- Latency tuning is like a sports car—fast to respond but less efficient for bulk transport.
JVM Memory Model and GC Role
The JVM divides memory into:
- Young Generation → Frequent collections, ideal for short-lived objects.
- Old Generation → Less frequent collections, holds long-lived objects.
- Metaspace → Class metadata.
GC algorithms decide when and how to collect these areas. The tuning flags and collector choice determine whether throughput or latency takes priority.
Major Garbage Collectors and Their Tuning
Parallel GC (Throughput-Oriented)
- Default in Java 8.
- Focuses on maximizing throughput.
- Uses multiple threads for minor and major collections.
- Tuning flags:
-XX:+UseParallelGC -XX:+UseParallelOldGC
CMS (Concurrent Mark-Sweep) [Deprecated]
- Reduced pause times but prone to fragmentation.
- Removed in Java 14.
G1 GC (Balanced Approach)
- Default in Java 11.
- Region-based collection, balances throughput and latency.
- Predictable pause times.
- Tuning flags:
-XX:+UseG1GC -XX:MaxGCPauseMillis=200
ZGC (Low-Latency)
- Available from Java 11 (experimental), stable in Java 15+.
- Targets <10ms pause times.
- Scales to multi-terabyte heaps.
- Tuning flags:
-XX:+UseZGC
Shenandoah (Low-Latency)
- Developed by Red Hat, integrated in OpenJDK.
- Concurrent compaction reduces pause times.
- Tuning flags:
-XX:+UseShenandoahGC
Tuning Parameters for Throughput vs Latency
Heap Size
- Larger heaps reduce GC frequency but increase pause times.
- For latency, use moderate heap sizes with ZGC/Shenandoah.
- For throughput, allow larger heaps with Parallel or G1.
Pause Time Goals
-XX:MaxGCPauseMillis(G1) → Set acceptable pause duration.- Lower values favor latency, higher values favor throughput.
Parallelism
-XX:ParallelGCThreads→ Controls GC worker threads.- For throughput: higher values.
- For latency: fewer threads to reduce interference.
Initiating Occupancy
-XX:InitiatingHeapOccupancyPercent→ Controls when concurrent cycles start.- Lower values reduce pause times but increase CPU overhead.
Real-World Case Studies
Case 1: High-Throughput Batch Job
- Scenario: ETL job on Java 8, long runtime.
- Tuning: Parallel GC with 8GB heap,
-Xms8g -Xmx8g. - Result: 30% faster job completion, pauses acceptable.
Case 2: Low-Latency Trading App
- Scenario: Java 17, requires <5ms response time.
- Tuning: ZGC with 16GB heap.
- Result: Pauses consistently <2ms, throughput trade-off acceptable.
Case 3: Balanced Microservice
- Scenario: REST API in Kubernetes.
- Tuning: G1 GC with
-XX:MaxGCPauseMillis=100. - Result: Stable response times, efficient memory usage.
Pitfalls and Troubleshooting
- Chasing Zero Pauses: Impossible—some pause is inevitable.
- Over-tuning Flags: Start with defaults, tune incrementally.
- Ignoring Logs: Always validate with
-Xlog:gc*. - Container Limits: JVM may exceed cgroup limits without
-XX:+UseContainerSupport.
Best Practices
- Choose GC based on workload, not hype.
- Always start with defaults before tuning.
- Use real workloads in testing, not synthetic benchmarks.
- Monitor with JFR, VisualVM, or Mission Control.
- Correlate GC performance with application SLAs.
Conclusion & Key Takeaways
- Throughput tuning maximizes work done but tolerates pauses.
- Latency tuning ensures predictable response times.
- Modern collectors (G1, ZGC, Shenandoah) provide more flexibility.
- Real-world testing is essential—no one-size-fits-all tuning.
FAQ
1. What is the JVM memory model and why does it matter?
It defines memory regions and concurrency rules, critical for GC correctness.
2. How does G1 GC differ from CMS?
G1 uses region-based collection with compaction; CMS fragmented memory.
3. When should I use ZGC or Shenandoah?
For ultra-low-latency workloads and very large heaps.
4. What are JVM safepoints and why do they matter?
Points where threads pause, allowing safe GC operations.
5. How do I solve OutOfMemoryError in production?
Analyze heap dumps, adjust -Xmx, and check for memory leaks.
6. What are the trade-offs of throughput vs latency tuning?
Throughput favors efficiency; latency favors consistency.
7. How do I read and interpret GC logs?
Check heap before/after, pause times, and frequency of collections.
8. How does JIT compilation optimize performance?
By compiling hot methods at runtime, reducing interpretation cost.
9. What’s the future of GC in Java (Project Lilliput)?
Smaller object headers for more efficient memory usage.
10. How does GC differ in microservices vs monoliths?
Microservices value latency predictability, monoliths often optimize for throughput.
