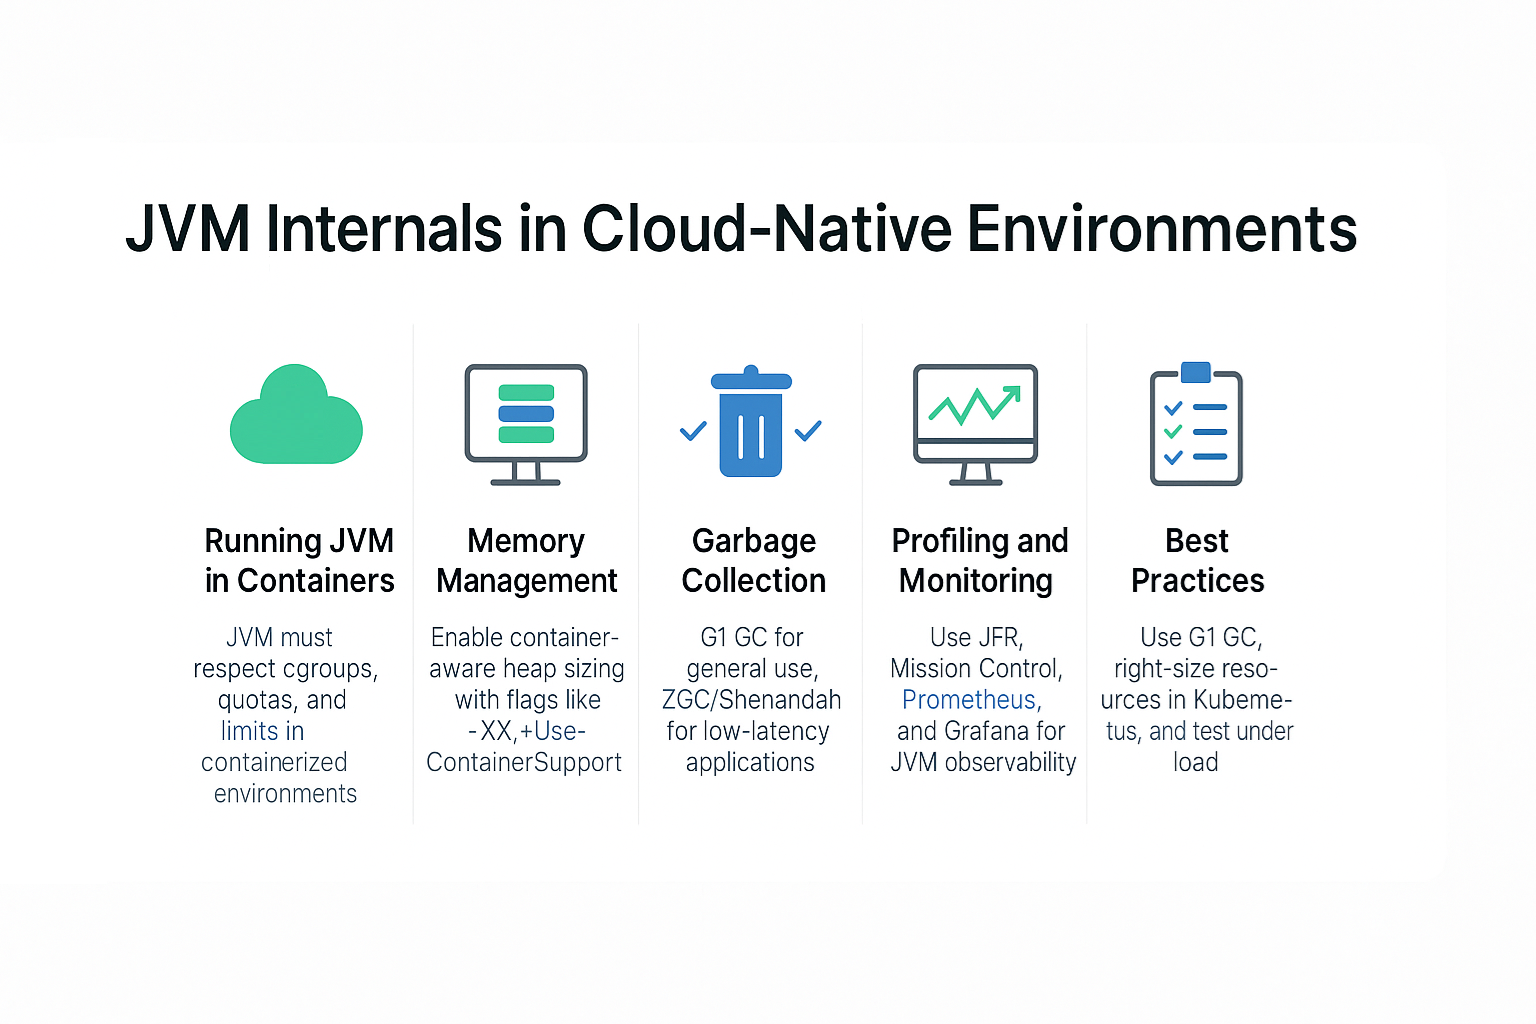
As enterprises embrace cloud-native architectures, Java applications increasingly run inside Docker containers orchestrated by Kubernetes. While the JVM is powerful, its behavior in containerized environments can surprise developers—leading to OOM errors, inefficient GC behavior, or CPU throttling.
This tutorial explores JVM internals in cloud-native deployments, explaining how memory, CPU, and GC tuning interact with Docker and Kubernetes. It provides best practices, case studies, and production-ready strategies for running Java workloads at scale.
JVM and Containers: Why It Matters
- JVM Assumptions: Traditionally assumes it owns the host.
- Container Reality: JVM must coexist with cgroups, limits, and quotas.
- Impact: Without tuning, JVM may over-allocate memory or underutilize CPU.
Analogy: Running a JVM in Docker is like driving a sports car in city traffic—capable of high speed, but limited by traffic rules (cgroups, quotas).
JVM Memory Management in Containers
Heap Sizing Challenges
- By default, JVM may allocate heap based on host memory, not container limits.
- Can lead to OOMKilled errors in Kubernetes.
Best Practices
-XX:+UseContainerSupport   # Default since Java 10
-XX:InitialRAMPercentage=50.0
-XX:MaxRAMPercentage=75.0
- Allows JVM to size heap based on container memory limits.
Metaspace and Native Memory
- Monitor with
jcmdorjmap. - Avoid memory leaks in JNI or thread stacks.
Garbage Collection in Cloud-Native Workloads
G1 GC (Default)
- Region-based, predictable.
- Works well for most microservices.
ZGC / Shenandoah
- Useful for latency-sensitive APIs.
- Scales with large heaps in cloud workloads.
Tuning Example
-XX:+UseG1GC -XX:MaxGCPauseMillis=200 -Xms2g -Xmx2g
CPU and Threading in Containers
JVM Thread Behavior
- Thread pools (ForkJoin, Executor) depend on available CPUs.
- Container CPU limits must be visible to JVM.
Best Practices
-XX:+UseContainerSupport
-XX:ActiveProcessorCount=4   # Match CPU quota in Kubernetes
Avoiding CPU Throttling
- Use Kubernetes Guaranteed QoS class for mission-critical pods.
- Avoid noisy-neighbor interference by setting CPU requests/limits correctly.
Profiling and Monitoring in Cloud-Native JVMs
- Java Flight Recorder (JFR): Lightweight, production-friendly.
- Mission Control: Analysis of memory/GC patterns.
- Prometheus + Grafana: JVM metrics in Kubernetes.
- Sidecar Profiling: Async profiler sidecars for deep diagnostics.
Case Study: E-commerce Microservices
Problem
- GC pauses spiking under flash-sale traffic.
- JVM allocating heap larger than container memory → OOMKilled.
Solution
- Enabled container support flags.
- Tuned G1 GC with
MaxRAMPercentage. - Added Prometheus/Grafana dashboards.
Result
- Stable response times under peak load.
- Zero OOMKilled incidents in production.
Pitfalls in Cloud-Native JVM Deployments
- OOMKilled due to heap sizing mismatch.
- Ignoring native memory consumption.
- CPU throttling under bursty traffic.
- Under-provisioned Kubernetes requests.
- Misinterpreting GC logs in containerized environments.
Best Practices for JVM in Docker/Kubernetes
- Always enable container-aware heap sizing.
- Use G1 GC for general workloads; ZGC/Shenandoah for low-latency.
- Right-size CPU/Memory requests and limits in Kubernetes.
- Monitor with JFR, Prometheus, and async-profiler.
- Test under realistic production traffic.
JVM Version Tracker
- Java 8: No container support by default, requires flags.
- Java 10: Introduced container awareness.
- Java 11: G1 default, JFR open-source.
- Java 17: ZGC + Shenandoah fully production-ready.
- Java 21+: NUMA-aware GC + Project Lilliput for better density.
Conclusion & Key Takeaways
- JVM in cloud-native environments must respect cgroup limits.
- Use container-aware heap sizing to prevent OOMKilled.
- G1 GC is the safe default; ZGC/Shenandoah for APIs needing low latency.
- Monitoring and profiling are essential for production stability.
- Always test JVM under Kubernetes load before scaling.
FAQ
1. What is the JVM memory model and why does it matter?
It governs visibility and correctness across threads in distributed workloads.
2. How does G1 GC differ from CMS?
G1 compacts memory regions; CMS left fragmentation.
3. When should I use ZGC or Shenandoah?
For cloud-native apps needing ultra-low latency and scalability.
4. What are JVM safepoints and why do they matter?
They halt threads briefly for GC or deoptimizations; in Kubernetes, they impact pod SLAs.
5. How do I solve OutOfMemoryError in containers?
Tune MaxRAMPercentage, monitor native memory, and use proper pod limits.
6. What are the trade-offs of throughput vs latency tuning?
Throughput prioritizes request-per-second; latency minimizes spikes.
7. How do I read and interpret GC logs in Kubernetes?
Correlate with pod metrics and request latencies.
8. How does JIT compilation optimize performance?
It inlines hot methods and reduces allocation overhead.
9. What’s the future of GC in Java (Project Lilliput)?
Smaller object headers improve heap density in containerized apps.
10. How does GC differ in microservices vs monoliths?
Microservices need predictable latency; monoliths optimize for throughput.
