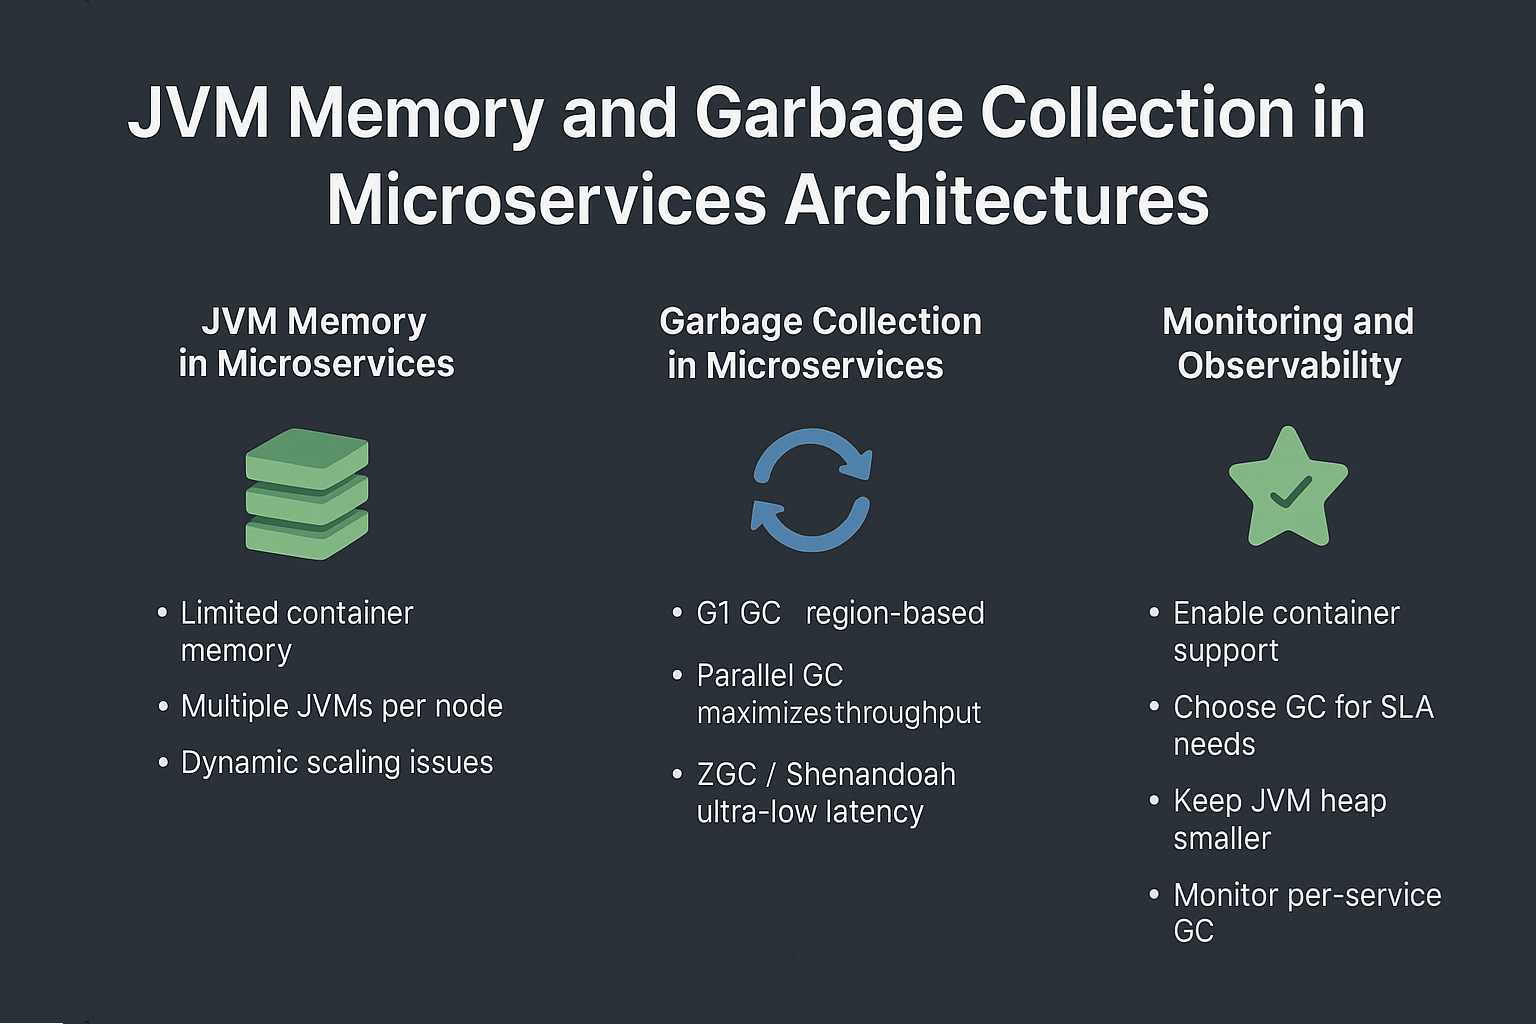
Microservices have revolutionized how applications are built and deployed, offering scalability, fault isolation, and rapid deployment. However, when running Java-based microservices, the JVM’s memory model and Garbage Collection (GC) behavior become critical factors in ensuring stability and efficiency.
Unlike monoliths, microservices run in resource-constrained containers and often face high concurrency with varying workloads. This tutorial explores how JVM memory and GC operate in microservices environments, providing tuning strategies and best practices.
JVM Memory in Microservices
The JVM organizes memory into several runtime data areas:
- Heap: Objects and arrays.
- Young Generation: Short-lived objects.
- Old Generation: Long-lived objects.
- Metaspace: Class metadata (replaces PermGen).
- Native Memory: Thread stacks, buffers, JNI allocations.
Challenges in Microservices
- Limited container memory → risk of OOMKilled in Kubernetes.
- Multiple JVMs running per node → memory contention.
- Dynamic scaling → memory tuning must adapt to pod size.
Best Practices
-XX:+UseContainerSupport
-XX:InitialRAMPercentage=50.0
-XX:MaxRAMPercentage=75.0
- Ensures JVM respects container memory limits.
Garbage Collection in Microservices
G1 GC (Default in Java 11+)
- Region-based, predictable.
- Works well for general-purpose microservices.
Parallel GC
- Maximizes throughput.
- Acceptable for batch-oriented microservices.
ZGC / Shenandoah
- Ultra-low latency.
- Ideal for latency-sensitive microservices (e.g., payment APIs).
Example GC Tuning for Microservices
-XX:+UseG1GC -Xms512m -Xmx512m -XX:MaxGCPauseMillis=200
JVM and Microservices Architecture Impact
Monolith vs Microservices
- Monoliths: Single large heap, optimized for throughput.
- Microservices: Many smaller JVMs, optimized for stability and latency.
Implications
- GC tuning must be applied at service level, not globally.
- Autoscaling requires lightweight GC tuning to avoid startup penalties.
Case Study: Payment Microservice
Problem
- Frequent OOMKilled during traffic spikes.
- GC pauses caused SLA breaches on API latency.
Solution
- Applied container-aware memory settings.
- Switched from G1 GC to ZGC for low-latency consistency.
- Tuned CPU limits with
-XX:ActiveProcessorCount.
Result
- Stable SLA compliance under traffic bursts.
- Reduced GC pause times <10ms.
Monitoring and Observability
- JFR (Java Flight Recorder): For low-overhead GC + memory tracking.
- Mission Control: Historical trend analysis.
- Prometheus + Grafana: JVM metrics in Kubernetes dashboards.
- Async Profiler: Identifying allocation hotspots.
Pitfalls in JVM Microservices Deployments
- Over-allocating heap beyond container limits.
- Ignoring native memory consumption.
- Excessive GC tuning flags without measurement.
- Assuming one GC fits all microservices.
- Lack of realistic load testing.
Best Practices
- Enable container support flags.
- Choose GC based on service SLA (throughput vs latency).
- Keep JVM heaps smaller and predictable.
- Monitor per-service GC behavior.
- Load-test before scaling.
JVM Version Tracker
- Java 8: Limited container support, CMS/G1.
- Java 11: G1 default, JFR open source.
- Java 17: ZGC + Shenandoah stable.
- Java 21+: NUMA-aware GC, Project Lilliput improvements.
Conclusion & Key Takeaways
- Microservices environments require GC and memory tuning per service.
- G1 GC is safe for most, ZGC/Shenandoah for latency-critical.
- Always respect container limits to avoid OOMKilled.
- Monitoring is as important as tuning.
FAQ
1. What is the JVM memory model and why does it matter?
It ensures thread safety while supporting efficient GC and optimizations.
2. How does G1 GC differ from CMS?
G1 uses region-based compaction, CMS relied on concurrent marking but left fragmentation.
3. When should I use ZGC or Shenandoah?
For microservices requiring sub-10ms latency, such as payments or trading APIs.
4. What are JVM safepoints and why do they matter?
They pause all threads for GC or JIT tasks; excessive safepoints hurt SLAs.
5. How do I solve OutOfMemoryError in microservices?
Set proper container-aware heap settings, reduce allocation churn, and monitor native memory.
6. What are the trade-offs of throughput vs latency tuning?
Throughput = batch jobs; Latency = interactive services.
7. How do I read and interpret GC logs?
Focus on pause durations, frequency, and heap usage before/after GC.
8. How does JIT compilation optimize performance?
By inlining methods, removing allocations, and escape analysis.
9. What’s the future of GC in Java (Project Lilliput)?
Improved object headers → smaller footprint in containerized JVMs.
10. How does GC differ in microservices vs monoliths?
Microservices prioritize predictable SLAs, while monoliths prioritize throughput.
