Few issues cause more fear in production Java systems than the dreaded java.lang.OutOfMemoryError (OOM). It often leads to service crashes, SLA violations, and frustrated customers.
This tutorial provides a comprehensive roadmap to understand, diagnose, and fix OutOfMemoryError in production environments. Whether you are running monoliths, microservices, or cloud-native apps, mastering OOM handling is crucial.
Understanding OutOfMemoryError
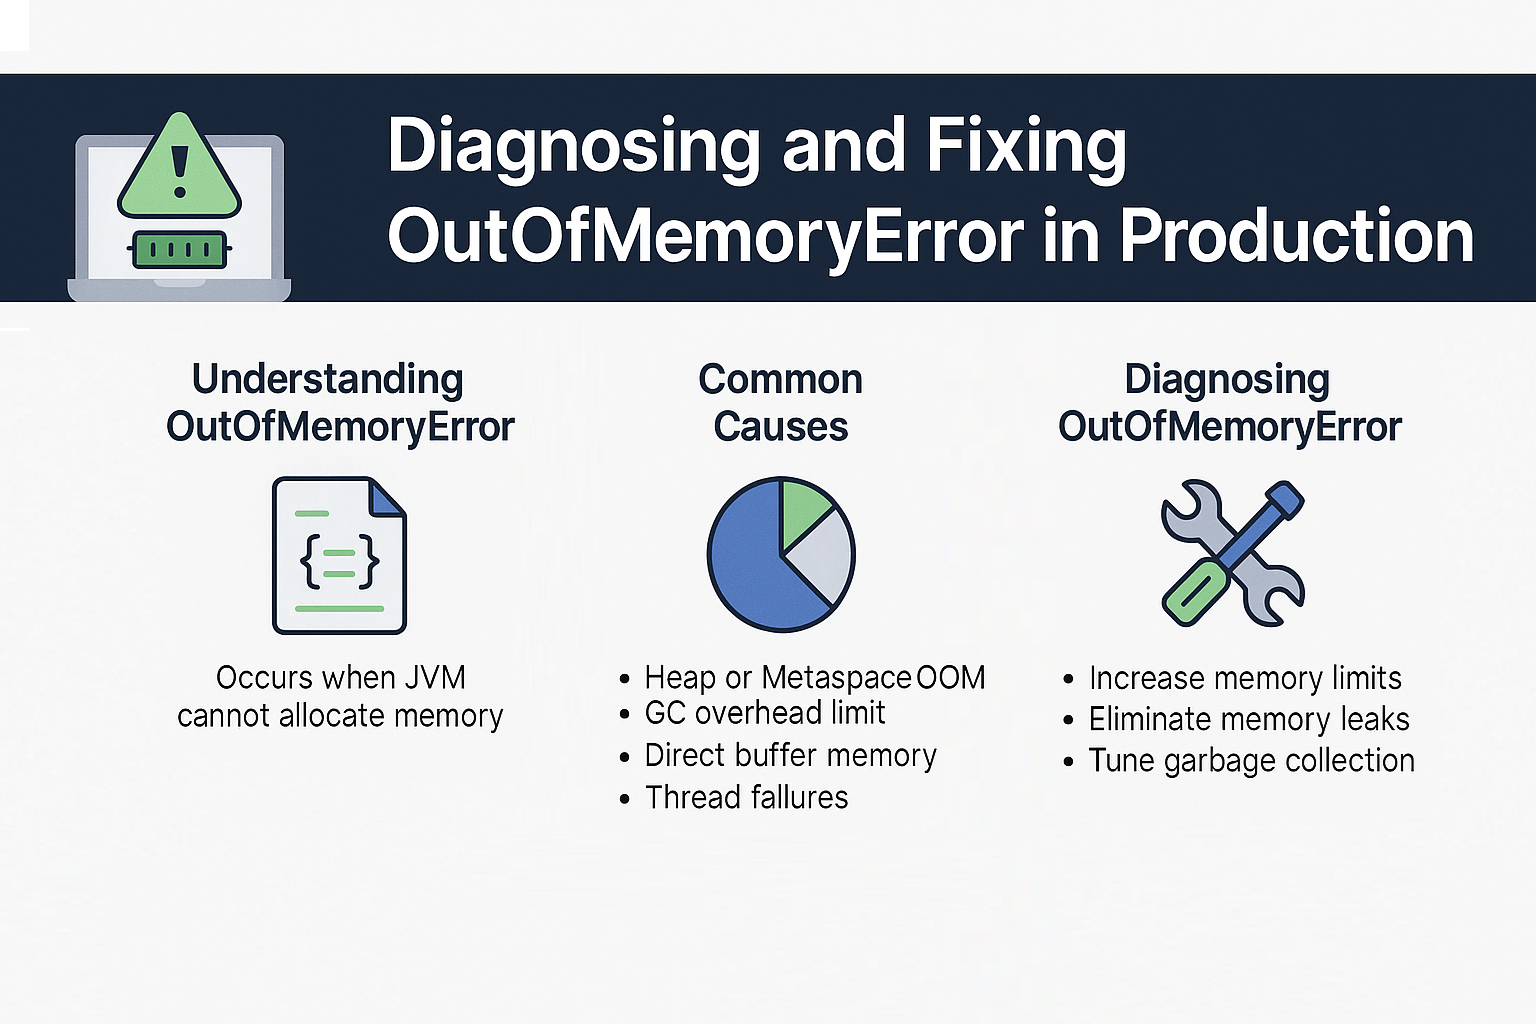
The JVM throws an OOM when it cannot allocate memory for new objects, even after garbage collection.
Common Causes:
- Heap space exhausted → too many live objects.
- Metaspace OOM → excessive class loading (classloader leaks).
- GC overhead limit exceeded → too much time spent in GC.
- Direct buffer memory → untracked native allocations.
- Thread creation failures → native memory exhaustion.
JVM Memory Model and OOM Types
Heap Space OOM
Exception in thread "main" java.lang.OutOfMemoryError: Java heap space
- Too many live objects or memory leak.
Metaspace OOM
Exception in thread "main" java.lang.OutOfMemoryError: Metaspace
- Excessive class loading, often in app servers or dynamic frameworks.
GC Overhead Limit Exceeded
java.lang.OutOfMemoryError: GC overhead limit exceeded
- JVM spends >98% time in GC with little progress.
Direct Buffer Memory
java.lang.OutOfMemoryError: Direct buffer memory
- Common with Netty or NIO apps using
ByteBuffer.allocateDirect().
Native Thread OOM
- JVM cannot create new threads due to system memory exhaustion.
Diagnosing OutOfMemoryError
Step 1: Collect Heap Dumps
Enable automatic dumps:
-XX:+HeapDumpOnOutOfMemoryError -XX:HeapDumpPath=/var/log/heapdump.hprof
Step 2: Analyze with Tools
- Eclipse MAT: Leak suspects, dominator trees.
- VisualVM: Live heap & GC tracking.
- Java Flight Recorder: Low-overhead profiling.
Step 3: Check GC Logs
Enable GC logging:
-Xlog:gc*:file=gc.log:time,uptime,level,tags
Step 4: Correlate with Metrics
- Monitor heap usage, thread counts, GC pauses.
- Use Prometheus + Grafana dashboards in Kubernetes.
Fixing OutOfMemoryError
Heap Space Issues
- Increase heap size with
-Xmx. - Eliminate leaks (close resources, fix caching).
- Reduce allocation churn (use object pools, primitive arrays).
Metaspace Issues
- Limit dynamic class loading.
- Fix classloader leaks in frameworks.
- Tune metaspace:
-XX:MaxMetaspaceSize=512m
GC Overhead Issues
- Switch to a more efficient GC (e.g., G1, ZGC).
- Optimize allocation rates.
Direct Memory Issues
- Track allocations via
-XX:MaxDirectMemorySize. - Release buffers explicitly in frameworks like Netty.
Thread Issues
- Reduce thread creation.
- Use async/reactive frameworks.
- Tune system ulimit values.
Case Study: E-Commerce Platform
Problem:
- OOM during peak sales due to heap leaks in product catalog service.
Solution:
- Analyzed heap dump, found unbounded HashMap retaining references.
- Fixed caching strategy with eviction policy.
- Increased
-Xmxand applied G1 GC.
Result:
- Stable SLA compliance during load spikes.
Pitfalls in Handling OOM
- Blindly increasing heap size.
- Ignoring native memory leaks.
- Relying only on GC logs without heap dump analysis.
- Not testing under production-like load.
Best Practices
- Always enable
HeapDumpOnOutOfMemoryError. - Set reasonable
Xmxaligned with container limits. - Monitor direct memory usage in NIO apps.
- Apply memory leak detection tools regularly.
- Automate alerts for high GC and memory pressure.
JVM Version Tracker
- Java 8: CMS common, OOM in PermGen replaced by Metaspace.
- Java 11: G1 default, better GC overhead handling.
- Java 17: ZGC/Shenandoah → reduced OOM from GC pressure.
- Java 21+: NUMA-aware GC, smaller object headers via Lilliput.
Conclusion & Key Takeaways
- OOM is not always a heap size problem; it can occur in metaspace, direct memory, or threads.
- Fix requires heap dumps, GC logs, and metrics correlation.
- Use leak detection, GC tuning, and resource management proactively.
- Treat OOM handling as part of DevOps observability.
FAQ
1. What is the JVM memory model and why does it matter?
It ensures thread safety and defines allocation rules, affecting GC and OOM.
2. How does G1 GC differ from CMS?
G1 is region-based and compacts memory, reducing fragmentation compared to CMS.
3. When should I use ZGC or Shenandoah?
When low-latency memory management is critical (financial or API workloads).
4. What are JVM safepoints and why do they matter?
Safepoints pause threads for GC/JIT tasks; too many pauses worsen OOM scenarios.
5. How do I solve OutOfMemoryError in production?
Collect heap dumps, analyze leaks, tune GC, right-size memory, and monitor.
6. What are the trade-offs of throughput vs latency tuning?
Throughput tuning may allow longer pauses, latency tuning prioritizes responsiveness.
7. How do I read and interpret GC logs?
Look at pause times, heap before/after GC, and promotion failures.
8. How does JIT compilation optimize performance?
By removing unnecessary allocations and reducing memory churn.
9. What’s the future of GC in Java (Project Lilliput)?
Smaller object headers reduce memory footprint, lowering OOM probability.
10. How does GC differ in microservices/cloud vs monoliths?
Microservices need smaller, predictable heaps; monoliths often prioritize throughput.
