When Java applications experience slowdowns, long pauses, or OutOfMemoryError, the first place to investigate is the Garbage Collector (GC). However, GC activity is often hidden inside the JVM, making it difficult to troubleshoot.
Two critical tools make this task easier: GC logs and Java Flight Recorder (JFR). Together, they provide detailed insights into memory usage, pause times, allocation behavior, and performance bottlenecks.
In this tutorial, we’ll explore how to use GC logs and JFR effectively for troubleshooting production systems, from detecting memory leaks to optimizing pause times.
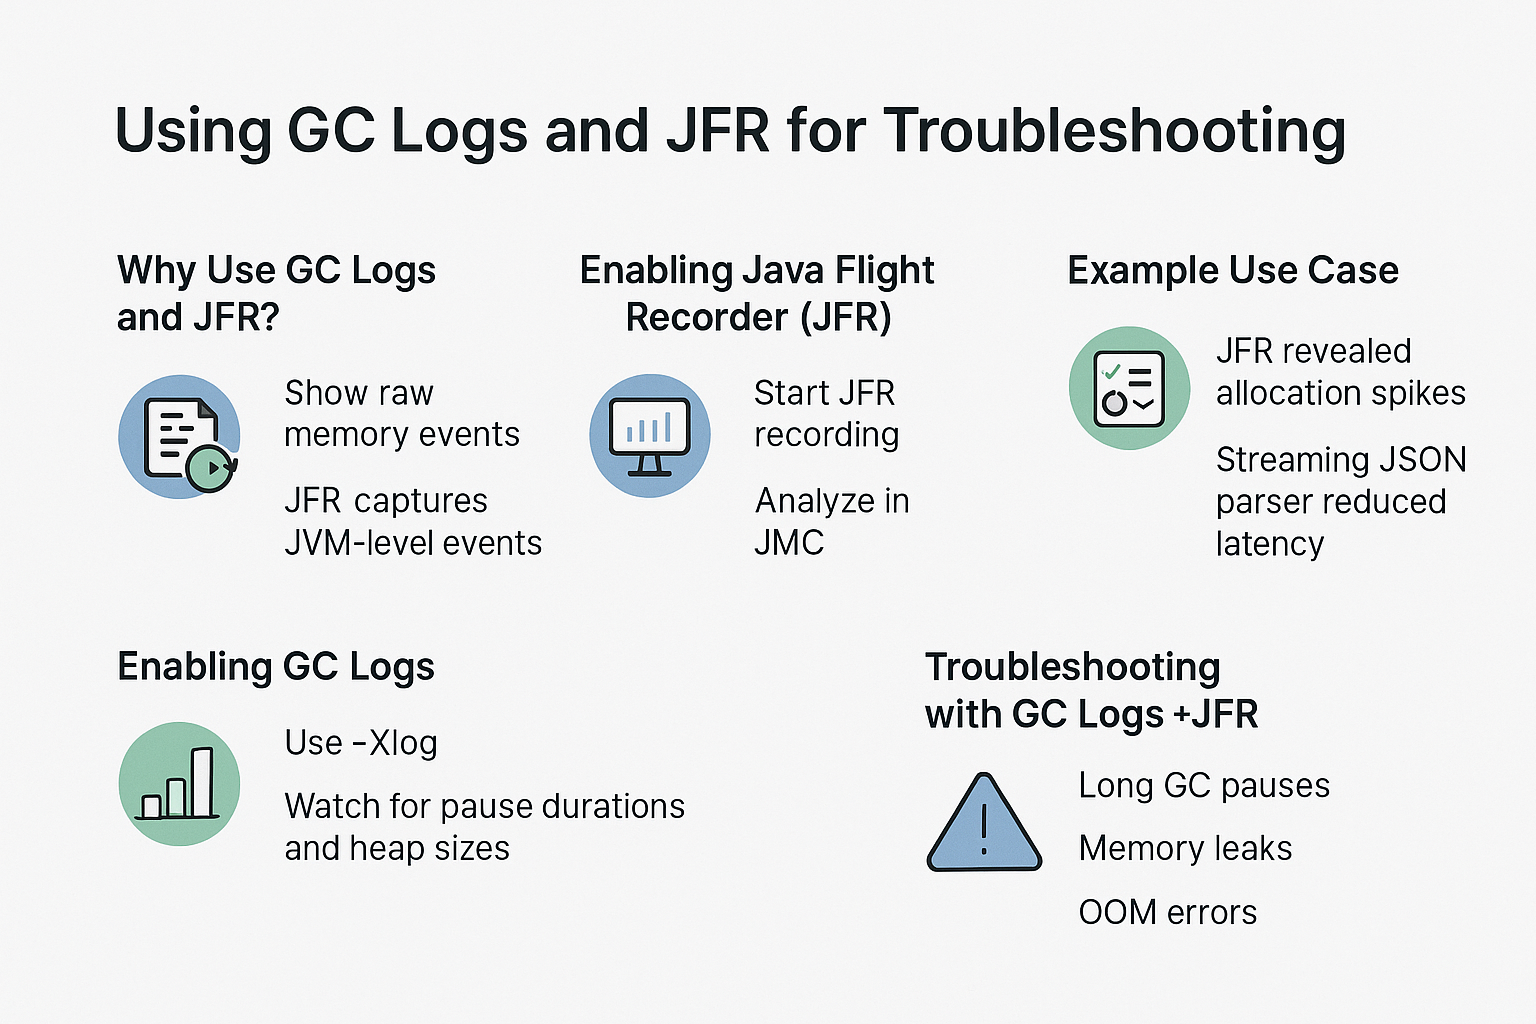
Why Use GC Logs and JFR?
- GC Logs: Show raw, low-level events about memory allocation, GC phases, and pause times.
- JFR: Captures system-level and JVM-level events with low overhead, ideal for production.
- Combined Approach: Logs show the "what", JFR shows the "why".
Enabling GC Logs
Java 8
java -Xloggc:gc.log -XX:+PrintGCDetails -XX:+PrintGCDateStamps -XX:+PrintGCTimeStamps MyApp
Java 9+ (Unified Logging)
java -Xlog:gc*:file=gc.log:time,uptime,level,tags MyApp
What to Look For
- Pause durations → Long pauses mean tuning needed.
- Heap before/after sizes → Indicates effectiveness of GC.
- Frequency of Full GCs → May suggest leaks or misconfiguration.
Example GC Log Entry
[2.345s][info][gc] GC(0) Pause Young (Normal) (G1 Evacuation Pause) 30M->10M(64M) 12.3ms
Interpretation:
- GC(0): First collection.
- Pause Young (G1 Evacuation Pause): Minor GC.
- 30M->10M(64M): Heap usage before, after, and capacity.
- 12.3ms: Pause duration.
Enabling Java Flight Recorder (JFR)
Starting JFR
java -XX:StartFlightRecording=filename=recording.jfr,duration=60s MyApp
Analyzing in Java Mission Control (JMC)
- Import the
.jfrfile into JMC. - Inspect GC activity timeline.
- Analyze allocation hotspots.
- Correlate thread dumps with GC pauses.
Example JFR Use Case
A production microservice showed latency spikes of 500ms. GC logs confirmed frequent young-gen collections, but the cause was unclear. JFR revealed JSON parsing library creating excessive short-lived objects. Switching to a streaming parser reduced allocation pressure and stabilized latency.
Comparing GC Logs vs JFR
| Feature | GC Logs | JFR (with JMC) |
|---|---|---|
| Overhead | Low | Very low |
| Detail Level | Memory focus | Holistic (GC, JIT, Threads, I/O) |
| Best For | Raw metrics | Deep diagnostics |
| Production Use | Always on | Short bursts or continuous |
Troubleshooting with GC Logs + JFR
Common Problems & Diagnosis
-
Long GC Pauses
- Logs: Identify pause duration and frequency.
- JFR: Correlate with allocation hotspots.
-
Memory Leaks
- Logs: Heap after GC doesn’t shrink.
- JFR: Class or object retaining references.
-
High CPU Usage
- Logs: Too frequent minor GCs.
- JFR: Excessive object churn.
-
OOM Errors
- Logs: OutOfMemoryError traces in logs.
- JFR: Pinpoints leaking class or allocation.
Best Practices
- Always enable GC logging in production.
- Use JFR during incidents to capture root cause.
- Automate GC log analysis (e.g., GCViewer, GCEasy).
- Correlate GC events with application metrics (APM, Prometheus).
- Tune incrementally; avoid guesswork.
JVM Version Tracker
- Java 8: Parallel GC default; JFR commercial (later open-sourced).
- Java 11: G1 GC default; JFR included free.
- Java 17: ZGC and Shenandoah stable.
- Java 21+: NUMA-aware GC, Project Lilliput optimizations.
Conclusion & Key Takeaways
- GC logs show raw GC activity—vital for identifying pauses and heap usage trends.
- JFR provides deep diagnostic insight into allocations, threads, and JIT.
- Used together, they are essential for troubleshooting production JVM systems.
- Always validate with real-world workloads in staging before applying fixes.
FAQ
1. What is the JVM memory model and why does it matter?
It defines heap, stack, and metaspace; GC troubleshooting relies on it.
2. How does G1 GC differ from CMS?
G1 uses regions and compaction; CMS fragmented old gen.
3. When should I use ZGC or Shenandoah?
For apps needing low-latency with large heaps.
4. What are JVM safepoints and why do they matter?
They are moments where threads pause for GC and JIT operations.
5. How do I solve OutOfMemoryError in production?
Use GC logs + JFR to detect leaks, adjust heap size, fix code.
6. What are the trade-offs of throughput vs latency tuning?
Throughput → more work, Latency → predictable pauses.
7. How do I read and interpret GC logs?
Focus on pause times, heap before/after, GC frequency.
8. How does JIT compilation optimize performance?
Compiles hot methods to native code, improving speed.
9. What’s the future of GC in Java (Project Lilliput)?
Smaller object headers → reduced memory footprint.
10. How does GC differ in microservices vs monoliths?
Microservices emphasize latency; monoliths may prioritize throughput.
