Java is known for its Write Once, Run Anywhere philosophy, thanks to the JVM. But Java doesn’t just interpret bytecode—it also dynamically compiles hot methods into native machine code using the Just-In-Time (JIT) compiler.
This process allows Java applications to achieve performance levels close to or even surpassing C++ in some cases, while still retaining portability. HotSpot, the most widely used JVM, employs advanced techniques like adaptive optimization, inlining, escape analysis, and tiered compilation to maximize performance.
In this tutorial, we’ll explore how JIT compilation works in the JVM, what optimizations HotSpot applies, and how developers can tune and monitor JIT behavior for production systems.
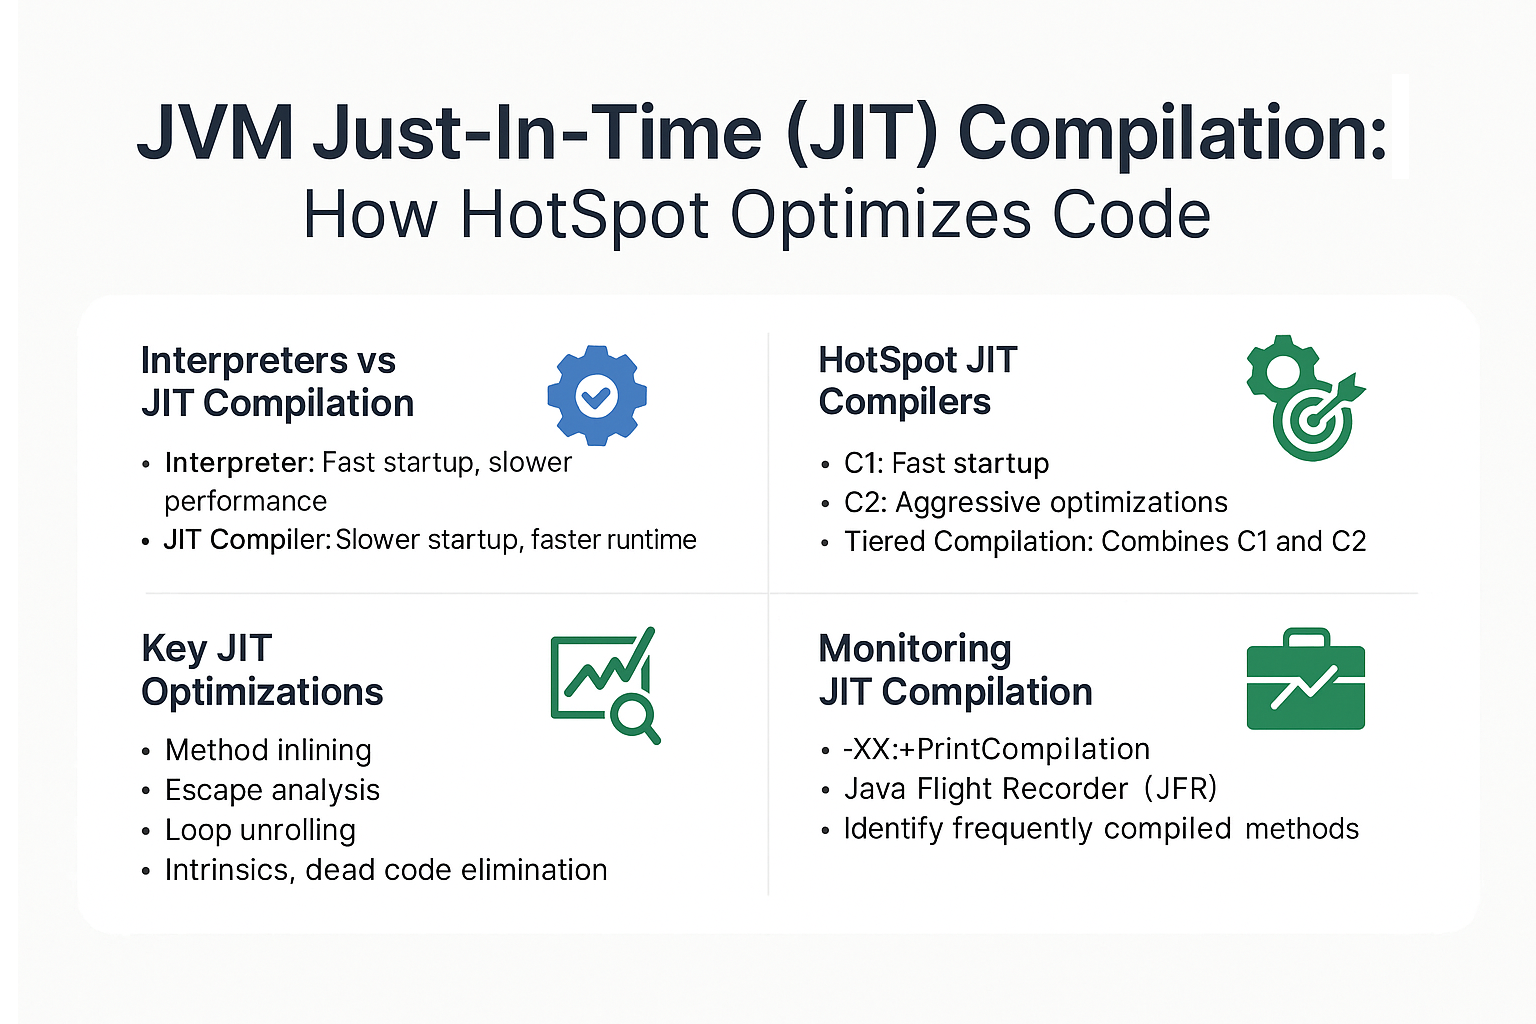
Interpreters vs JIT Compilation
- Interpreter: Executes bytecode instructions line by line.
- Fast startup, slower runtime performance.
- JIT Compiler: Translates frequently executed methods (“hot methods”) into native machine code.
- Slower startup, faster runtime after warm-up.
Analogy: Think of the interpreter as a translator reading word-for-word, while JIT acts like a teacher who memorizes and repeats common sentences fluently.
How JIT Works in HotSpot
Step 1: Profiling & Hotspot Detection
- JVM profiles execution at runtime.
- Methods with high invocation counts are marked as “hot.”
Step 2: Compilation
- JIT compiles hot methods into native code.
- Result: Faster execution, since native code runs directly on CPU.
Step 3: Adaptive Optimization
- JIT monitors program behavior.
- If assumptions break (e.g., type changes), it can de-optimize and recompile.
HotSpot JIT Compilers
HotSpot uses two main JIT compilers:
-
C1 (Client Compiler)
- Optimized for quick startup and smaller applications.
- Applies lightweight optimizations.
-
C2 (Server Compiler)
- Aggressive optimizations for long-running apps.
- Suitable for backend servers and enterprise systems.
-
Tiered Compilation (Default in Java 8+)
- Combines C1 and C2.
- C1 compiles early for fast startup, C2 recompiles hot methods with deeper optimizations.
Key JIT Optimizations
1. Method Inlining
- Replaces method calls with the method body.
- Reduces call overhead and allows further optimizations.
2. Escape Analysis
- Determines if objects can be safely allocated on the stack.
- Reduces heap allocation and GC pressure.
3. Loop Unrolling
- Expands loops for fewer iterations.
- Improves CPU pipeline efficiency.
4. Intrinsics
- Replaces common operations (
System.arraycopy,Math.sin) with highly optimized native instructions.
5. Dead Code Elimination
- Removes code paths proven to be unreachable at runtime.
Monitoring JIT Compilation
Enable JIT Logging
-XX:+UnlockDiagnosticVMOptions -XX:+PrintCompilation -XX:+LogCompilation
Using JFR + JMC
- Record compilation events.
- Identify frequently compiled methods.
- Detect performance cliffs due to de-optimization.
Example: JIT in Action
public class JITExample {
    public static int compute(int x) {
        return x * 2;
    }

    public static void main(String[] args) {
        for (int i = 0; i < 1_000_000; i++) {
            compute(i);
        }
    }
}
- Initially interpreted.
- After many iterations,
computebecomes hot → JIT compiles it. - Further runs are near-native speed.
Real-World Case Study: Trading System
- Problem: High latency during market open.
- Diagnosis: JIT warm-up phase slowed response.
- Solution: Used Tiered Compilation and warmed up services before trading hours.
- Result: Latency dropped by 40%.
Pitfalls and Troubleshooting
- Warm-up time: JIT requires execution before optimizing.
- De-optimization: Incorrect assumptions may force recompilation.
- Over-tuning: Too many JIT flags can reduce performance.
- JIT vs AOT: Ahead-of-Time compilation (Java 9+) can help in low-latency apps.
Best Practices
- Use tiered compilation (default).
- Warm up applications in staging before production load.
- Profile with JFR + Mission Control for JIT activity.
- Avoid premature tuning—defaults are strong.
- Combine JIT with GC tuning for balanced performance.
JVM Version Tracker
- Java 8: Tiered compilation default, PermGen removed.
- Java 11: G1 default, JIT improvements.
- Java 17: ZGC/Shenandoah stable, continued JIT refinements.
- Java 21+: Project Lilliput reduces object header size, JIT adapts to new memory layouts.
Conclusion & Key Takeaways
JIT compilation is one of the JVM’s greatest strengths.
- Interprets code first, then compiles hot methods to native code.
- Optimizations like inlining and escape analysis boost performance.
- Monitoring with logs and JFR is essential for tuning.
- Defaults are reliable, but advanced users can fine-tune JIT for mission-critical apps.
By understanding JIT, developers can unlock the JVM’s full performance potential.
FAQ
1. What is the JVM memory model and why does it matter?
It defines how threads and memory interact; JIT must follow these rules.
2. How does G1 GC differ from CMS?
G1 is region-based with compaction; CMS fragmented memory.
3. When should I use ZGC or Shenandoah?
When low-latency is critical and heap sizes are large.
4. What are JVM safepoints and why do they matter?
Safepoints pause threads so GC and JIT can safely operate.
5. How do I solve OutOfMemoryError in production?
Analyze heap dumps, tune -Xmx, fix memory leaks.
6. What are the trade-offs of throughput vs latency tuning?
Throughput = efficiency, Latency = predictable pauses.
7. How do I read and interpret GC logs?
Focus on pause times, memory usage before/after, GC type.
8. How does JIT compilation optimize performance?
It compiles hot code paths into native code, removing interpretation overhead.
9. What’s the future of GC in Java (Project Lilliput)?
Smaller headers improve memory efficiency, helping JIT optimize further.
10. How does GC differ in microservices vs monoliths?
Microservices prioritize latency; monoliths often optimize throughput.
