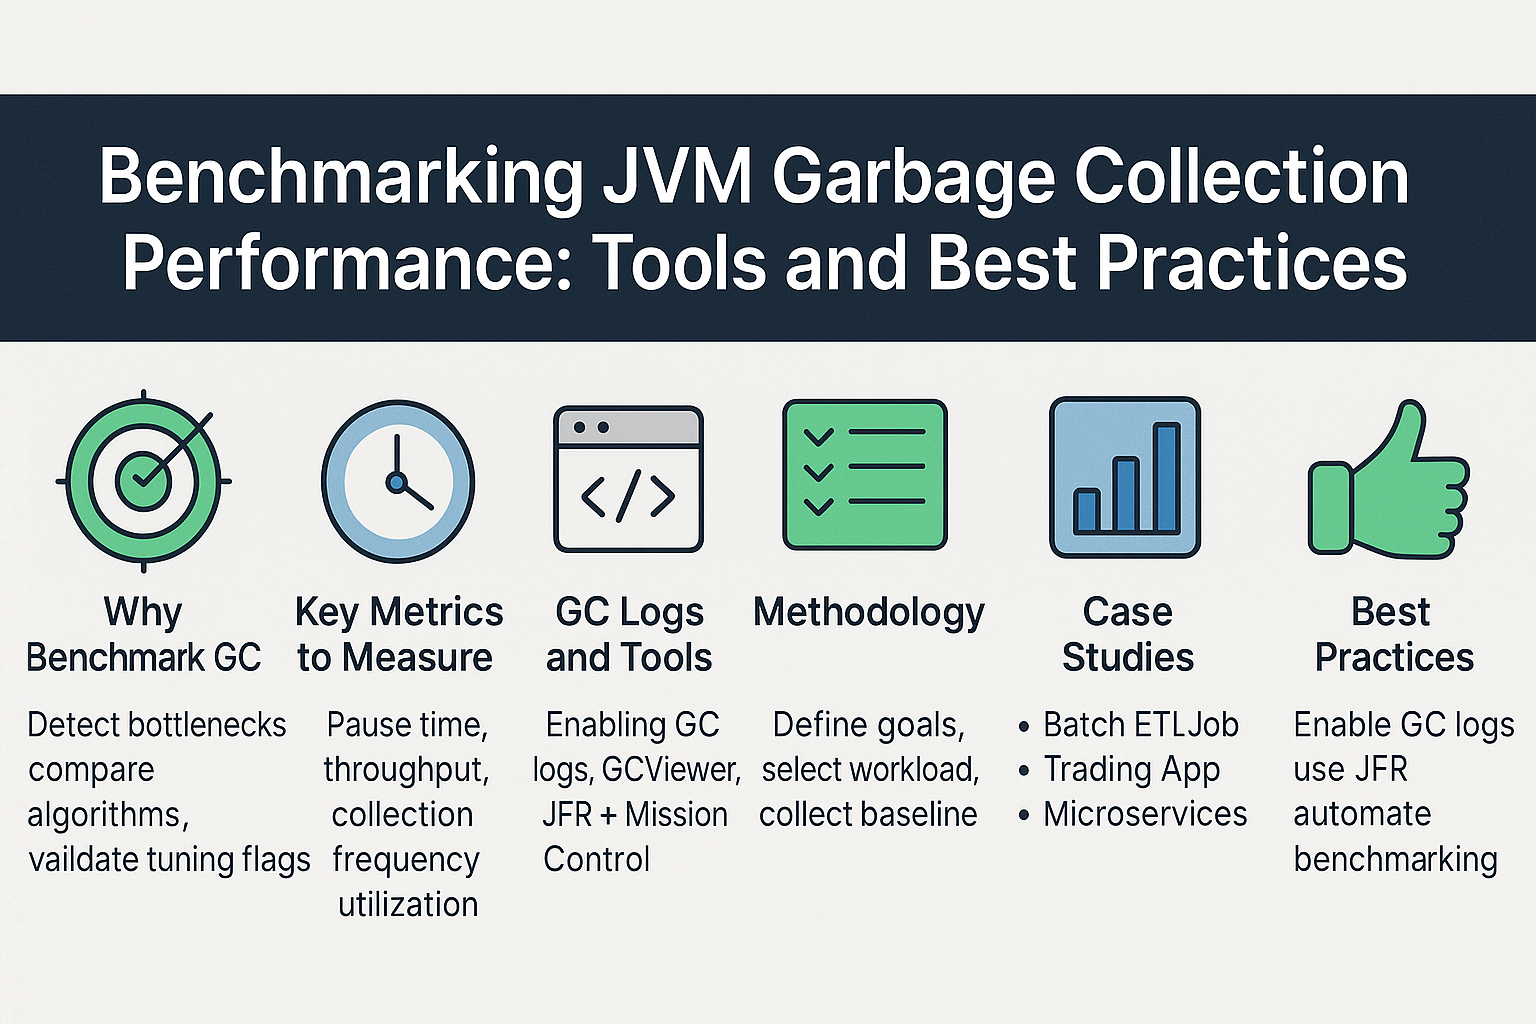
Performance problems in Java applications often stem from Garbage Collection (GC) behavior—either frequent pauses, unpredictable latency, or inefficient memory usage. Optimizing GC requires measurement and benchmarking, not guesswork.
Benchmarking GC performance helps developers understand:
- How often collections occur
- How long pauses last
- How much memory is reclaimed
- Which GC algorithm performs best under real-world workloads
In this tutorial, we’ll cover the tools, methodologies, and best practices for benchmarking GC performance effectively in Java applications.
Why Benchmark GC?
- Detect bottlenecks early.
- Compare GC algorithms (Parallel, G1, ZGC, Shenandoah).
- Validate tuning flags (
-Xms,-Xmx,-XX). - Ensure production workloads meet SLAs.
- Optimize cloud resource utilization (important in microservices).
Key Metrics to Measure
- Pause time (latency): How long Stop-the-World events last.
- Throughput: Percentage of time spent doing application work vs GC.
- Frequency of collections: Minor vs Major GC events.
- Heap utilization: Memory before/after GC.
- Promotion rate: Objects moved from young to old generation.
Tools for Benchmarking GC Performance
1. GC Logs
- Java 8:
-XX:+PrintGCDetails -XX:+PrintGCDateStamps -Xloggc:gc.log - Java 9+:
-Xlog:gc*:file=gc.log:time,uptime,level,tags - Analysis tools: GCViewer, GCEasy, GarbageCat.
2. Java Flight Recorder (JFR) + Mission Control
- Low-overhead, production-safe.
- Records GC events, allocations, safepoints.
- Best for correlating GC with CPU/threads.
3. JMH (Java Microbenchmark Harness)
- Framework for benchmarking Java code.
- Can measure allocation rate and GC behavior in microbenchmarks.
- Example:
@Benchmark
public void testAlloc() {
    String s = new String("abc");
}
4. VisualVM / JConsole
- Heap and GC visualization.
- Useful in dev/test environments.
5. Container/Cloud Metrics
- Kubernetes + Prometheus + Grafana → GC pause monitoring.
- APM tools (New Relic, AppDynamics, Datadog) → integrated GC insights.
Methodology for GC Benchmarking
Step 1: Define Goals
- Throughput vs Latency?
- Batch processing vs Interactive services?
Step 2: Select Workload
- Use realistic workloads, not synthetic tests.
- Reproduce production traffic patterns.
Step 3: Collect Baseline
- Enable GC logs.
- Run with default collector.
- Record throughput, pause times, heap trends.
Step 4: Experiment with GCs
- Parallel GC for throughput.
- G1 for balanced.
- ZGC/Shenandoah for low-latency.
Step 5: Tune Flags Incrementally
- Adjust
-Xmx,-Xms. - Tune pause targets (
-XX:MaxGCPauseMillis). - Analyze results before further changes.
Step 6: Automate Benchmarking
- Integrate with CI/CD pipelines.
- Compare GC results across releases.
Case Studies
Case 1: Batch ETL Job
- Setup: Parallel GC, 16GB heap.
- Observation: High throughput but 2s pauses.
- Tuning: Switched to G1 with
MaxGCPauseMillis=500. - Result: Reduced pauses, acceptable throughput trade-off.
Case 2: Latency-Sensitive Trading App
- Setup: ZGC with 32GB heap.
- Observation: <5ms pauses.
- Result: SLA met, predictable latency.
Case 3: Microservices in Kubernetes
- Setup: G1 GC, heap limited to 2GB by container.
- Observation: OOMKilled due to cgroup mismatch.
- Solution: Enabled
-XX:+UseContainerSupport. - Result: Stable memory usage.
Pitfalls and Troubleshooting
- Synthetic benchmarks lie: Always benchmark with production-like load.
- Ignoring container memory limits: JVM may over-allocate without flags.
- Over-tuning: Too many flags degrade performance.
- Short test runs: Run long enough to observe old-gen collections.
Best Practices
- Always enable GC logging in prod.
- Use JFR for deep analysis.
- Benchmark on representative hardware.
- Tune step by step, not all at once.
- Automate GC benchmarking in CI/CD.
- Validate against application-level metrics (latency, throughput).
JVM Version Tracker
- Java 8: Parallel GC default. CMS available.
- Java 11: G1 GC default.
- Java 17: ZGC and Shenandoah stable.
- Java 21+: NUMA-aware GC, Project Lilliput reducing object headers.
Conclusion & Key Takeaways
Benchmarking GC is not just about JVM tuning—it’s about ensuring application reliability and performance.
- Define clear goals (throughput vs latency).
- Use GC logs, JFR, and benchmarking tools like JMH.
- Test under real-world workloads.
- Tune incrementally and validate with metrics.
- Automate benchmarking for long-term stability.
FAQ
1. What is the JVM memory model and why does it matter?
It defines heap, stack, and metaspace—key for GC tuning.
2. How does G1 GC differ from CMS?
G1 is region-based with compaction; CMS fragmented old gen.
3. When should I use ZGC or Shenandoah?
For low-latency workloads with large heaps.
4. What are JVM safepoints and why do they matter?
They allow threads to pause consistently for GC/JIT work.
5. How do I solve OutOfMemoryError in production?
Check GC logs, heap dumps, tune heap, fix leaks.
6. What are the trade-offs of throughput vs latency tuning?
Throughput = efficiency; Latency = predictable response.
7. How do I read and interpret GC logs?
Look at heap before/after, pause times, and frequency.
8. How does JIT compilation optimize performance?
Compiles hot methods to native code, reducing interpretation cost.
9. What’s the future of GC in Java (Project Lilliput)?
Smaller object headers improve memory efficiency.
10. How does GC differ in microservices vs monoliths?
Microservices prioritize latency; monoliths often prioritize throughput.
