Enterprise applications demand scalability, reliability, and high performance. Whether it’s a banking system, e-commerce platform, or ERP solution, JVM tuning determines how efficiently resources are used under massive workloads.
This checklist acts as a step-by-step guide for JVM performance tuning in production environments. From memory settings to GC choice, from JIT optimizations to monitoring, this resource helps both beginners and advanced developers create robust JVM-based enterprise systems.
JVM Architecture and Memory Model
The JVM organizes memory into:
- Heap: For object allocation (young/old generation).
- Metaspace: Class metadata (dynamic, replaces PermGen).
- Native Memory: Thread stacks, direct buffers, JNI.
Checklist:
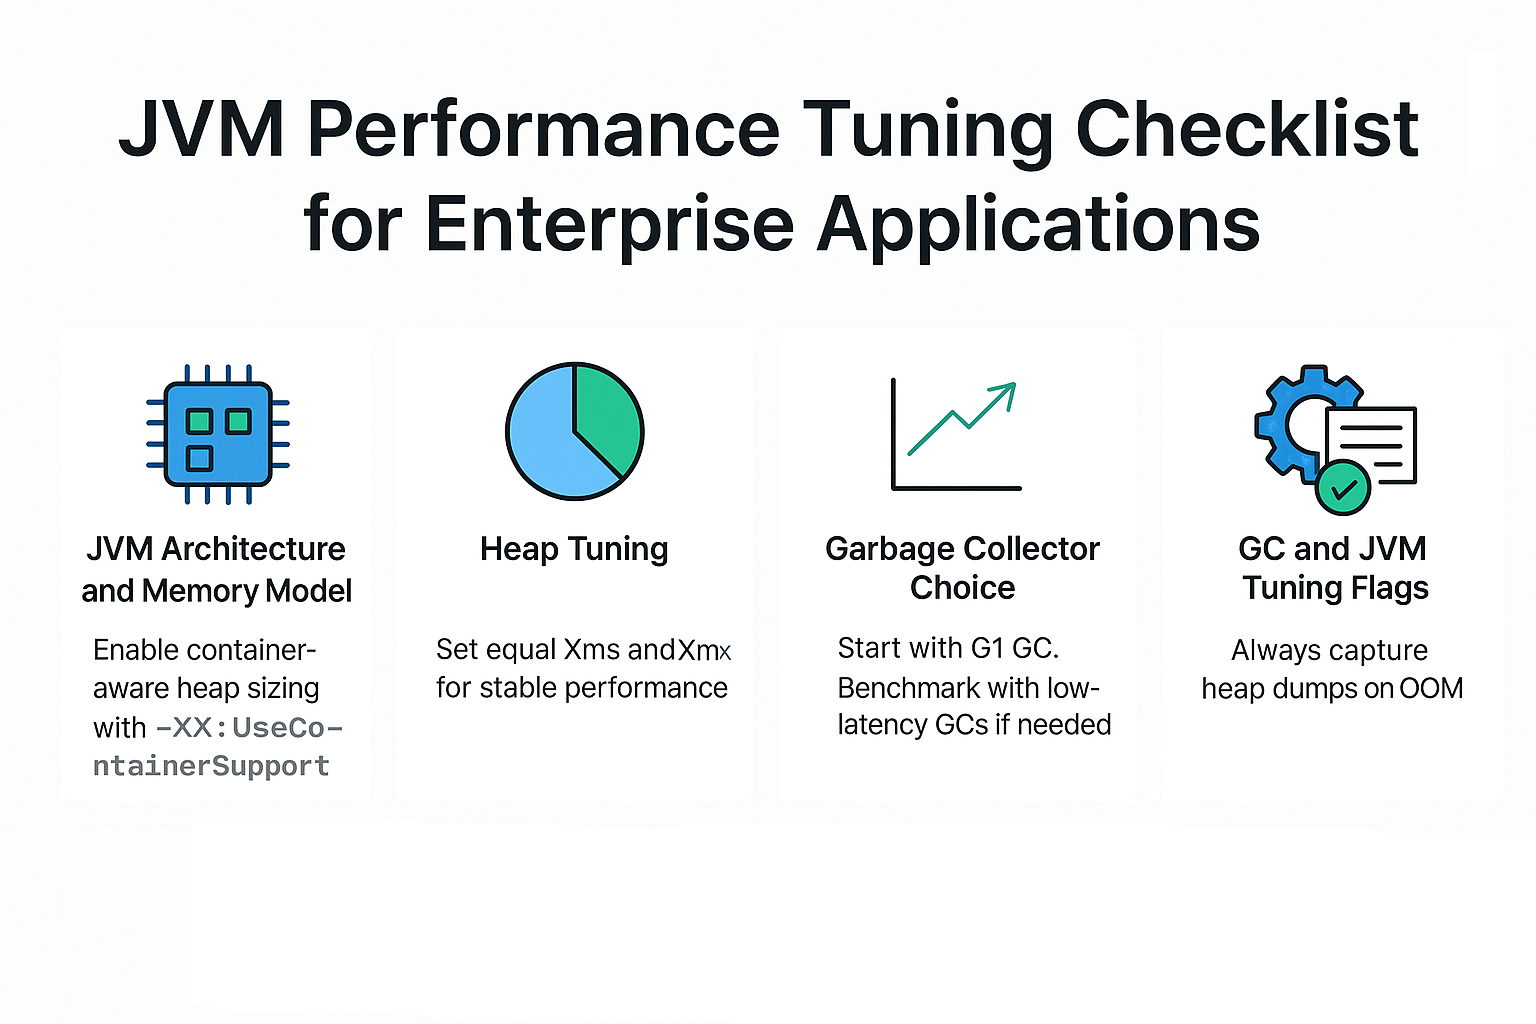
- [ ] Enable container-aware heap sizing with
-XX:+UseContainerSupport. - [ ] Monitor Metaspace and avoid classloader leaks.
- [ ] Reserve native memory for threads and buffers.
Heap Tuning: Xms, Xmx, and Metaspace
- Set equal Xms and Xmx for stable performance.
- Use percentages for containerized apps:
-XX:InitialRAMPercentage=50.0
-XX:MaxRAMPercentage=75.0
- Monitor metaspace growth with:
-XX:MetaspaceSize=256m -XX:MaxMetaspaceSize=512m
Checklist:
- [ ] Avoid dynamic heap resizing in production.
- [ ] Always benchmark different heap sizes.
Garbage Collector Choice
Parallel GC
- Best for throughput-oriented batch jobs.
G1 GC (Default in Java 11+)
- Balanced for most enterprise workloads.
ZGC & Shenandoah
- For ultra-low latency enterprise APIs.
Checklist:
- [ ] Start with G1 GC.
- [ ] Benchmark with ZGC/Shenandoah if latency SLAs are strict.
- [ ] Tune pause targets:
-XX:MaxGCPauseMillis=200
Just-In-Time (JIT) Compilation
- JVM compiles hot methods at runtime.
- C1 (client compiler): Fast startup.
- C2 (server compiler): Aggressive optimizations.
- Tiered compilation: Combination of both.
Checklist:
- [ ] Keep tiered compilation enabled.
- [ ] Profile for deoptimization hotspots.
- [ ] Enable JIT logs when troubleshooting:
-XX:+UnlockDiagnosticVMOptions -XX:+LogCompilation
GC and JVM Tuning Flags
Commonly used parameters:
-Xms4g -Xmx4g
-XX:+UseG1GC
-XX:MaxGCPauseMillis=200
-XX:+HeapDumpOnOutOfMemoryError
-XX:HeapDumpPath=/var/log/heapdump.hprof
Checklist:
- [ ] Always capture heap dumps on OOM.
- [ ] Use meaningful GC pause targets.
- [ ] Keep GC logs enabled:
-Xlog:gc*:file=gc.log:time,uptime,level,tags
Monitoring and Observability
- VisualVM / JConsole: Local JVM monitoring.
- Java Flight Recorder (JFR): Lightweight profiling.
- Mission Control: Deep JVM analytics.
- Prometheus + Grafana: Production monitoring in Kubernetes.
Checklist:
- [ ] Enable JFR in production for diagnostics.
- [ ] Aggregate GC logs across services.
- [ ] Correlate JVM metrics with business KPIs.
Pitfalls to Avoid
- Relying only on defaults.
- Over-tuning GC without real benchmarks.
- Ignoring native memory and thread limits.
- Not testing under realistic production load.
Best Practices
- Benchmark under peak traffic simulations.
- Right-size heap and metaspace for each service.
- Choose GC based on workload type.
- Automate JVM flags via infrastructure configs.
- Monitor continuously with alerts.
JVM Version Tracker
- Java 8: CMS used widely, G1 optional.
- Java 11: G1 default, JFR free.
- Java 17: ZGC + Shenandoah production-ready.
- Java 21+: NUMA-aware GC and Project Lilliput improvements.
Conclusion & Key Takeaways
- JVM tuning is a continuous process—defaults may not fit enterprise workloads.
- Start with G1 GC, but evaluate ZGC/Shenandoah.
- Memory sizing must match container/Kubernetes limits.
- Monitoring and profiling are as important as tuning.
- A checklist-driven approach ensures predictable, stable JVM performance.
FAQ
1. What is the JVM memory model and why does it matter?
It governs thread visibility and consistency for concurrency.
2. How does G1 GC differ from CMS?
G1 uses region-based compaction; CMS did not.
3. When should I use ZGC or Shenandoah?
For APIs requiring sub-10ms latency SLAs.
4. What are JVM safepoints and why do they matter?
They pause all threads for GC/JIT work; tuning reduces their impact.
5. How do I solve OutOfMemoryError in enterprise apps?
Capture heap dumps, analyze leaks, resize heap, and tune GC.
6. What are the trade-offs of throughput vs latency tuning?
Throughput maximizes batch efficiency; latency tuning minimizes pause spikes.
7. How do I read and interpret GC logs?
Look at pause duration, frequency, and allocation trends.
8. How does JIT compilation optimize performance?
By inlining, eliminating redundant code, and optimizing loops.
9. What’s the future of GC in Java (Project Lilliput)?
Smaller headers → improved memory efficiency and GC speed.
10. How does GC differ in microservices vs monoliths?
Microservices optimize for predictable latency; monoliths for throughput.
