A well-tuned Java application runs smoothly, balancing memory efficiency and performance. But when garbage collection (GC) pauses grow long or memory usage spikes, developers need visibility into what the JVM is doing under the hood.
This is where monitoring tools like JVisualVM, JConsole, and Java Mission Control (JMC) come into play. They provide real-time insights into the JVM’s memory behavior, GC events, and performance bottlenecks.
In this tutorial, we’ll explore how these tools work, how to use them effectively, and what insights they provide for optimizing garbage collection in Java 8 through Java 21+.
Why Monitor Garbage Collection?
Monitoring GC is critical because it helps you:
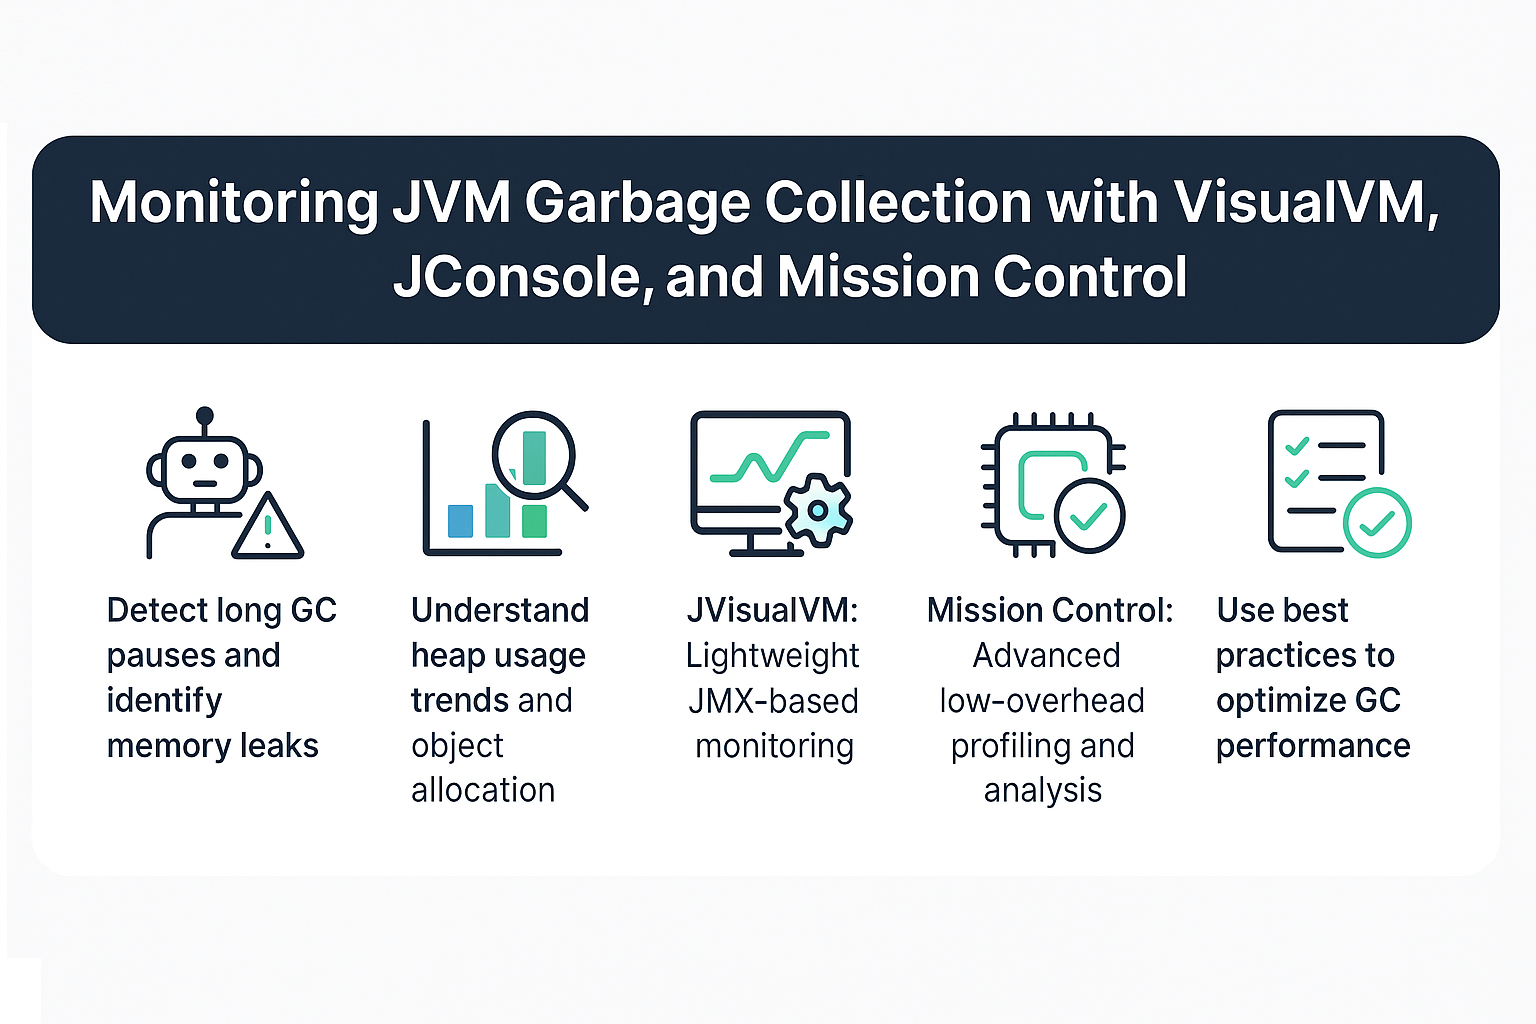
- Detect long GC pauses that cause latency issues.
- Identify memory leaks early.
- Understand heap usage trends and object allocation behavior.
- Fine-tune GC algorithms and JVM flags for production.
- Validate performance improvements during tuning.
For high-throughput microservices, trading platforms, or cloud-native applications, ignoring GC metrics can lead to unpredictable downtime and poor scalability.
Overview of Monitoring Tools
JVisualVM
- A GUI-based tool bundled with most JDK distributions (or available separately).
- Provides real-time monitoring of heap usage, GC activity, threads, and CPU profiling.
- Supports heap dumps and plugin extensions.
JConsole
- Lightweight JMX-based monitoring tool.
- Useful for basic memory and thread monitoring.
- Lower overhead than VisualVM, suitable for quick diagnostics.
Java Mission Control (JMC)
- Advanced low-overhead profiling tool.
- Works with Java Flight Recorder (JFR) for production-grade monitoring.
- Ideal for analyzing GC pause times, allocation hotspots, and JIT compilation behavior.
Using JVisualVM for GC Monitoring
Setup
- Launch with
jvisualvmcommand. - Connect to a running JVM (local or remote).
- Navigate to the Monitor and Visual GC tabs.
Key Features
- Heap graph showing Eden, Survivor, and Old Gen usage.
- GC activity graph (minor vs major collections).
- Ability to trigger manual GC for testing.
- Heap dump analysis to track down leaks.
Example Screenshot Interpretation
- A sawtooth pattern in the heap graph indicates regular minor GCs.
- Flattened growth in old gen may indicate a leak.
- Consistent pause times confirm stable GC tuning.
Using JConsole for GC Monitoring
Setup
- Launch with
jconsolecommand. - Connect to your JVM process.
- Open the Memory tab.
Key Features
- Live graphs of heap memory pools.
- Number of collections performed.
- Average collection times.
- Easy way to monitor Metaspace usage (Java 8+).
Limitations
- Limited to basic metrics.
- No deep heap dump or profiling capabilities.
- Higher latency in large-scale production workloads.
Using Mission Control + JFR
Setup
- Enable JFR with:
java -XX:StartFlightRecording=filename=recording.jfr,duration=60s MyApp - Launch JMC (
jmccommand). - Load the
.jfrrecording.
Key Features
- GC pause time analysis.
- Allocation profiling: which classes allocate most memory.
- Safepoint statistics.
- JIT compiler activity.
- Thread dumps correlated with GC events.
Real-World Example
A microservice under heavy load showed 100ms GC pauses. JFR revealed excessive allocations in JSON parsing. Switching to a streaming parser reduced pauses to <10ms.
Comparing the Tools
| Feature | JVisualVM | JConsole | Mission Control |
|---|---|---|---|
| Heap Monitoring | ✅ | ✅ | ✅ |
| GC Activity | ✅ | ✅ | ✅ |
| Heap Dump | ✅ | ❌ | ✅ |
| Allocation Profiling | ❌ | ❌ | ✅ |
| Overhead | Medium | Low | Very Low |
| Best For | Dev/Test | Quick Checks | Production Tuning |
GC Monitoring Across JVM Versions
- Java 8 → VisualVM/JConsole standard; CMS logs common.
- Java 11 → G1 default GC; JMC + JFR integrated.
- Java 17 → ZGC and Shenandoah logging supported; JFR improvements.
- Java 21+ → ZGC stable; NUMA-aware features for scalability.
Pitfalls and Troubleshooting
- Tool Overhead → Avoid attaching VisualVM in production for long periods.
- Security Restrictions → Remote monitoring requires JMX configuration.
- Incomplete Data → JConsole provides only surface-level insights.
- Ignoring Trends → Focus on long-term patterns, not single snapshots.
Best Practices for GC Monitoring
- Always enable GC logs alongside monitoring.
- Use JVisualVM during development to catch leaks early.
- Use Mission Control + JFR in production for low-overhead insights.
- Automate monitoring in Kubernetes/Docker environments with Prometheus exporters.
- Correlate GC metrics with application-level SLAs.
Conclusion & Key Takeaways
Monitoring GC is essential for building scalable and resilient Java systems.
- JVisualVM: Great for dev/test heap and GC visualization.
- JConsole: Quick checks and lightweight monitoring.
- Mission Control: Low-overhead production-grade insights.
By combining these tools, developers gain visibility into the JVM’s inner workings and can fine-tune GC for performance, reliability, and efficiency.
FAQ
1. What is the JVM memory model and why does it matter?
It defines how threads see shared memory—key for GC correctness and concurrency.
2. How does G1 GC differ from CMS?
G1 uses region-based collection; CMS fragmented old gen and is now deprecated.
3. When should I use ZGC or Shenandoah?
When ultra-low latency is required, especially for large heaps.
4. What are JVM safepoints and why do they matter?
They are synchronization points where threads stop to allow safe GC operations.
5. How do I solve OutOfMemoryError in production?
Check heap dumps in VisualVM, analyze GC logs, and tune -Xmx.
6. What are the trade-offs of throughput vs latency tuning?
Throughput aims for max work done; latency tuning minimizes pauses.
7. How do I read and interpret GC logs?
Enable -Xlog:gc* and correlate log events with heap graphs in monitoring tools.
8. How does JIT compilation optimize performance?
It compiles hot code paths, reducing interpretation overhead.
9. What’s the future of GC in Java (Project Lilliput)?
It reduces object header size, optimizing memory efficiency.
10. How does GC differ in microservices vs monoliths?
Microservices need predictable latency; monoliths often optimize for throughput.
