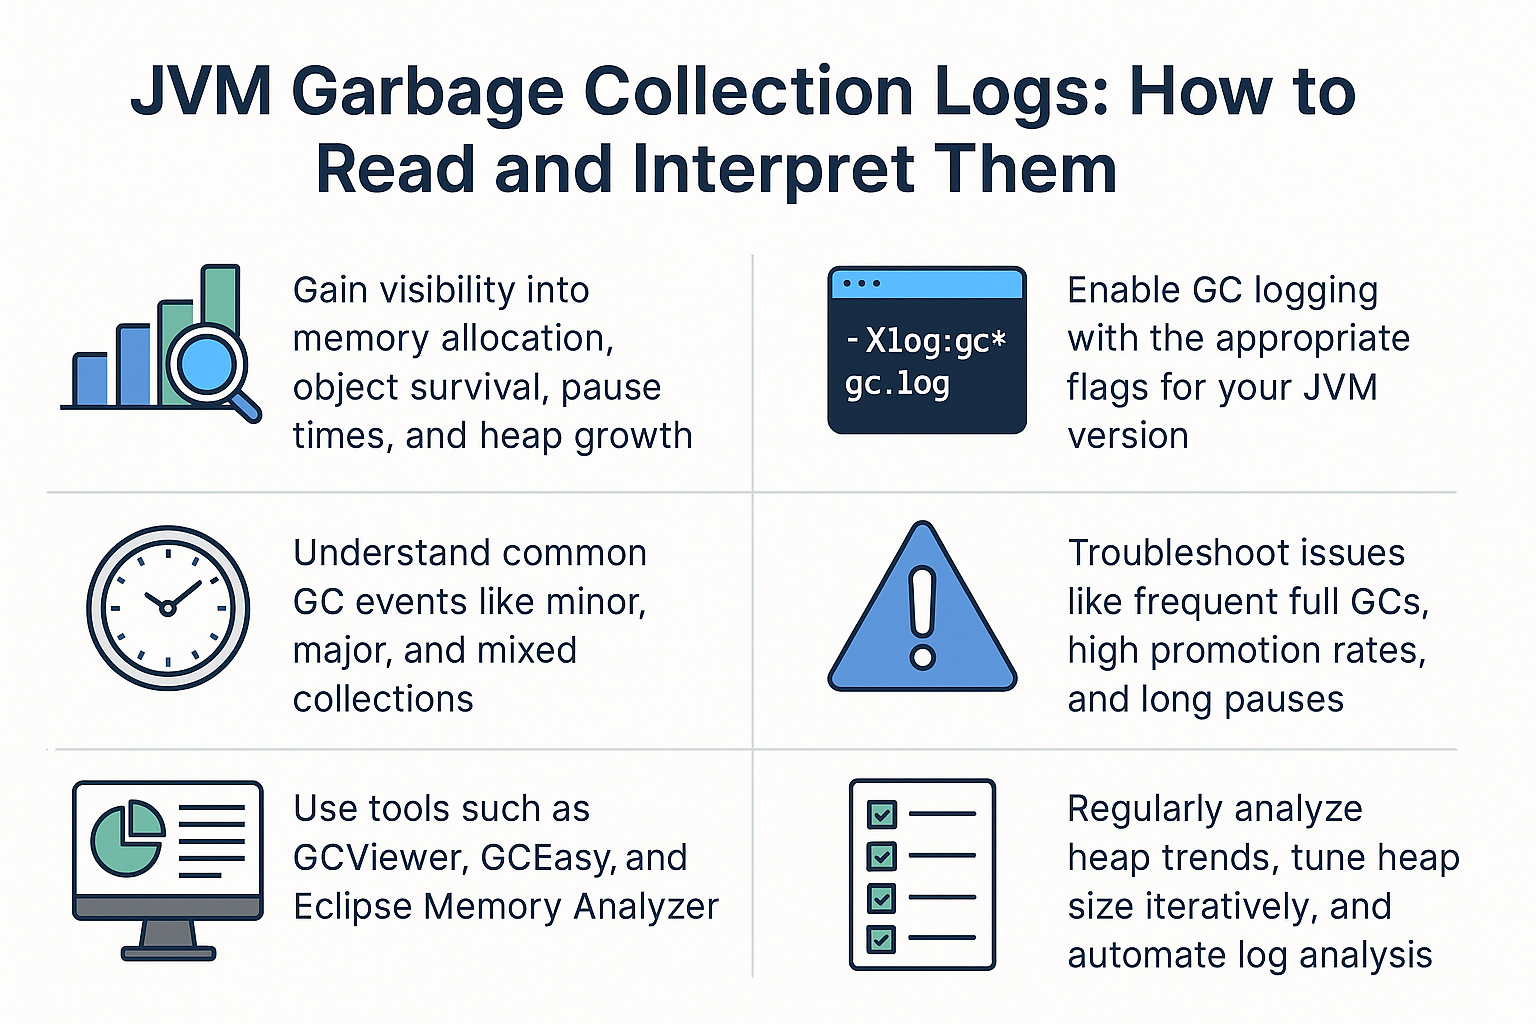
When your Java application suddenly slows down, stalls under load, or crashes with an OutOfMemoryError, one of the first places developers turn is the JVM Garbage Collection (GC) logs. These logs are the black box recorder of the JVM’s memory management system, capturing every pause, allocation, and cleanup decision.
Yet, for many developers, GC logs look cryptic—filled with timestamps, region IDs, and obscure flags. Learning how to decode them is essential for performance tuning, capacity planning, and ensuring production reliability.
This tutorial provides a step-by-step guide to reading and interpreting GC logs, with examples across JVM versions (Java 8 → 21+), real-world case studies, and best practices for tuning.
Why GC Logs Matter
GC logs give you visibility into:
- How memory is being allocated and reclaimed
- Which objects survive collections (potential memory leaks)
- Pause times and their impact on latency
- Heap growth trends that signal sizing problems
- GC algorithm behavior under production workloads
Without this visibility, tuning JVM applications in large-scale systems like microservices, trading platforms, or high-throughput APIs becomes guesswork.
Enabling GC Logs
Java 8 and Earlier
java -Xloggc:gc.log -XX:+PrintGCDetails -XX:+PrintGCDateStamps -XX:+PrintGCTimeStamps MyApp
Java 9+ (Unified Logging)
java -Xlog:gc*:file=gc.log:time,uptime,level,tags MyApp
Common Flags
-Xms/-Xmx→ Set heap size.-XX:+UseG1GC→ Select G1 collector.-XX:+UnlockExperimentalVMOptions -XX:+UseZGC→ Use ZGC.
Anatomy of a GC Log Entry
Example (Java 11 G1 GC):
[2.345s][info][gc] GC(0) Pause Young (Normal) (G1 Evacuation Pause) 30M->10M(64M) 12.345ms
Breakdown:
- [2.345s] → Uptime of JVM when GC occurred.
- GC(0) → Collection ID (first event).
- Pause Young (Normal) → Collection type (Young Gen GC).
- 30M->10M(64M) → Heap usage before, after, and total capacity.
- 12.345ms → Pause duration.
Understanding Different GC Events
Minor GC (Young Collection)
- Cleans up short-lived objects in the young generation.
- Frequent but usually fast.
- Look for survivor promotion rates.
Major GC (Old/Tenured Collection)
- Cleans up long-lived objects in the old generation.
- Less frequent but more expensive.
- Watch for Full GC events—can freeze applications.
Mixed GC (G1)
- Cleans both young and old regions.
- Tuned for predictable pause times.
Concurrent Phases (ZGC, Shenandoah)
- GC runs mostly in parallel with the application.
- Logs show very short pauses (<10ms).
Example: G1 GC Log Walkthrough
[5.678s][info][gc,start     ] GC(1) Pause Young (G1 Evacuation Pause)
[5.678s][info][gc,heap      ] GC(1) Eden regions: 5->0(6)
[5.678s][info][gc,heap      ] GC(1) Survivor regions: 1->1(2)
[5.678s][info][gc,heap      ] GC(1) Old regions: 2->2
[5.678s][info][gc,metaspace ] Metaspace: 10M->10M(105M)
[5.690s][info][gc           ] GC(1) Pause Young (G1 Evacuation Pause) 20M->12M(64M) 12.0ms
Interpretation:
- Eden space cleared (
5->0). - One region promoted to survivor.
- Old generation stable (no major promotion).
- Heap shrank from 20M to 12M.
- GC pause took 12ms, acceptable for most systems.
GC Logs Across JVM Versions
Java 8 (Parallel / CMS)
- Verbose
PrintGCDetailsoutput. - CMS logs show "remark" and "concurrent sweep".
Java 11 (G1 Default)
- Region-based logs.
- More structured Unified Logging.
Java 17 → 21+ (ZGC, Shenandoah)
- Concurrent phases dominate logs.
- Pauses extremely short (<1ms in some cases).
- Emphasis on scalability with huge heaps.
GC Log Pitfalls and Troubleshooting
- Frequent Full GCs → Heap too small or memory leak.
- High promotion rates → Objects incorrectly surviving young gen.
- Long pauses → Misconfigured GC or unsuitable collector.
- OutOfMemoryError despite GC → Unreachable memory leaks (e.g., static maps).
Case Study: Low-Latency Trading App
A trading platform using Java 17 with G1 experienced 50ms GC pauses during market spikes. Analysis showed excessive promotion to old gen due to oversized caches. Solution:
- Switched to ZGC for low-latency.
- Introduced
WeakReferencein caches. - Pauses dropped to <5ms.
Best Practices for GC Logs
- Always enable GC logs in production.
- Use tools: GCViewer, GCEasy, Eclipse Memory Analyzer.
- Regularly analyze heap usage trends.
- Tune heap size iteratively—avoid arbitrary values.
- Automate GC log analysis in CI/CD for microservices.
Conclusion & Key Takeaways
GC logs are the JVM’s memory diary. By learning to read them, you can:
- Detect leaks and inefficiencies early.
- Optimize for throughput vs latency trade-offs.
- Choose the right GC algorithm for your workload.
- Build resilient applications for the cloud era.
FAQ
1. What is the JVM memory model and why does it matter?
It governs visibility and ordering of memory operations, critical for GC correctness.
2. How does G1 GC differ from CMS?
G1 is region-based and predictable; CMS was concurrent but fragmented memory.
3. When should I use ZGC or Shenandoah?
For ultra-low latency apps (e.g., finance, real-time analytics).
4. What are JVM safepoints and why do they matter?
Safepoints are moments when all threads pause to allow safe GC operations.
5. How do I solve OutOfMemoryError in production?
Check heap dumps, analyze GC logs, fix leaks, or adjust -Xmx.
6. What are the trade-offs of throughput vs latency tuning?
Throughput → max work done; Latency → minimal pauses.
7. How do I read and interpret GC logs?
Look at event type, heap usage before/after, pause times, and promotions.
8. How does JIT compilation optimize performance?
It compiles hot code paths, reducing interpretation overhead.
9. What’s the future of GC in Java (Project Lilliput)?
Smaller object headers = reduced memory footprint.
10. How does GC differ in microservices vs monoliths?
Microservices prioritize latency (ZGC), monoliths often optimize throughput.
