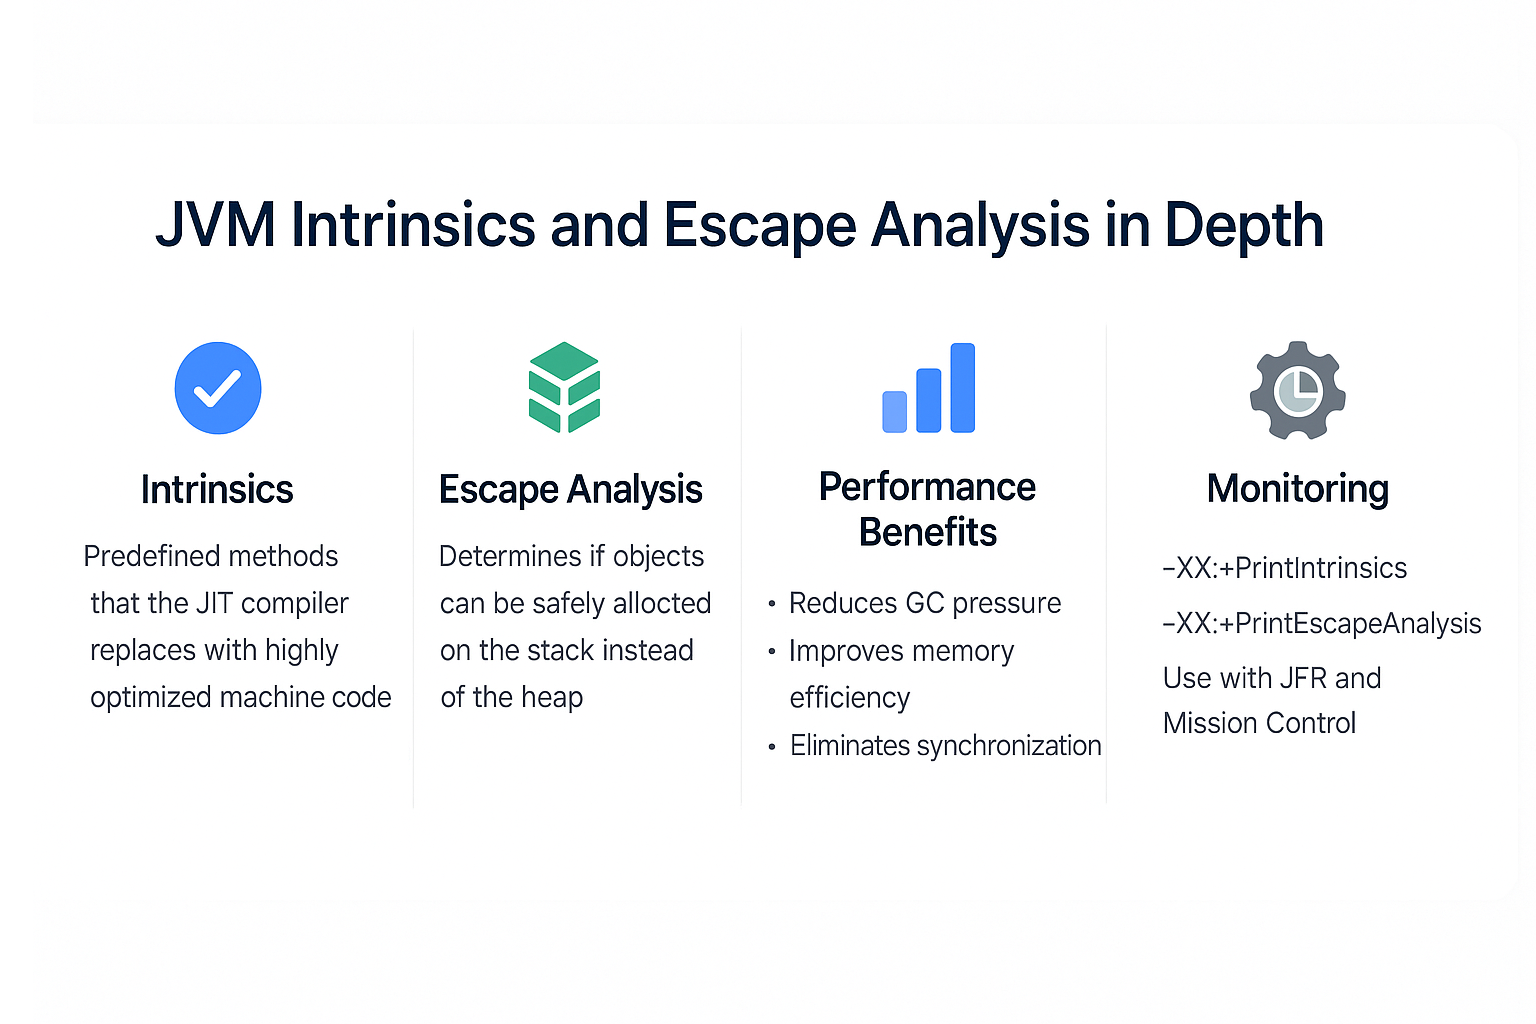
The JVM is not just an interpreter or a simple compiler—it is a sophisticated execution engine that continuously optimizes running applications. Two of the most powerful techniques it uses are Intrinsics and Escape Analysis.
- Intrinsics allow the JVM to replace certain method calls with highly optimized native instructions.
- Escape Analysis enables the JIT compiler to decide whether objects can be safely allocated on the stack instead of the heap, reducing GC pressure.
Together, they dramatically improve performance, memory efficiency, and GC behavior in Java applications. This tutorial explores how these techniques work, why they matter, and how to observe their effects in production.
What Are JVM Intrinsics?
Definition
Intrinsics are predefined methods in the JDK that the JIT compiler replaces with hand-optimized machine code for faster execution.
Examples of Intrinsics
- Math operations:
Math.sin(),Math.sqrt(),Math.log() - Array operations:
System.arraycopy() - String operations:
String.equals(),String.indexOf() - Atomic operations:
Unsafe.compareAndSwapInt()
Why Intrinsics Matter
- Reduce method call overhead.
- Map directly to CPU instructions.
- Improve performance of critical paths like cryptography, string handling, and array operations.
Escape Analysis
Definition
Escape analysis determines whether an object created in a method “escapes” its scope (method or thread).
Categories of Escapes
- No Escape: Object is confined to the method.
- JVM may allocate it on the stack.
- Thread-Local Escape: Object is confined to a single thread.
- JVM can eliminate synchronization.
- Global Escape: Object is shared outside method/thread.
- Must remain on the heap.
Benefits
- Stack Allocation: Avoids heap allocation, reducing GC load.
- Scalar Replacement: Breaks an object into primitive fields, avoiding allocation entirely.
- Synchronization Elimination: Removes
synchronizedoverhead when locks are thread-local.
Example: Escape Analysis in Action
public class EscapeExample {
    static class Point {
        int x, y;
    }

    public int compute() {
        Point p = new Point(); // May not escape
        p.x = 10;
        p.y = 20;
        return p.x + p.y;
    }
}
Without Escape Analysis
Pointallocated on heap.- GC eventually reclaims it.
With Escape Analysis
Pointallocated on stack or eliminated via scalar replacement.- No GC overhead.
Monitoring Intrinsics and Escape Analysis
JVM Flags
-XX:+UnlockDiagnosticVMOptions -XX:+PrintIntrinsics→ List all intrinsics.-XX:+PrintCompilation -XX:+UnlockDiagnosticVMOptions -XX:+PrintEscapeAnalysis→ Show escape analysis decisions.-XX:+DoEscapeAnalysis(enabled by default).
Using JFR + Mission Control
- Track allocations.
- Verify if objects are being scalar replaced.
- Detect excessive synchronization not eliminated.
Real-World Case Studies
Case 1: High-Performance REST API
- Issue: Excessive GC pauses.
- Diagnosis: Many short-lived objects on heap.
- Solution: Escape analysis eliminated allocations → stack allocation.
- Result: 25% GC overhead reduction.
Case 2: String-Heavy Application
- Issue: Slow string comparisons.
- Diagnosis: Hot methods used
String.equals(). - Solution: Intrinsics mapped it to optimized machine code.
- Result: 2x faster comparisons.
Case 3: Financial Trading System
- Issue: Synchronization bottleneck.
- Diagnosis: Thread-local objects still synchronized.
- Solution: Escape analysis removed unnecessary synchronization.
- Result: Latency reduced by 40%.
Pitfalls and Troubleshooting
- Escape Analysis not always possible: Complex code paths prevent stack allocation.
- JIT de-optimizations: Assumptions may be invalidated at runtime.
- Intrinsics depend on CPU support: Some may not apply on older processors.
- Too much reliance: Don’t over-optimize expecting intrinsics; JVM may change across versions.
Best Practices
- Trust the JVM defaults—escape analysis is usually enabled.
- Use intrinsics wisely—favor standard library methods (
System.arraycopy,Math) over custom implementations. - Profile with JFR and GC logs before tuning.
- Avoid micro-optimizations that reduce readability for negligible gains.
- Keep JVM updated—intrinsics and escape analysis improve with each release.
JVM Version Tracker
- Java 8: Escape analysis stable, many intrinsics added.
- Java 11: More intrinsics for strings and
VarHandle. - Java 17: ZGC and Shenandoah reduce GC impact, working well with escape analysis.
- Java 21+: Project Lilliput + smaller object headers = even more effective escape analysis.
Conclusion & Key Takeaways
- Intrinsics: Replace high-frequency JDK methods with optimized native instructions.
- Escape Analysis: Allocates objects on the stack or removes them entirely when safe.
- Together, they reduce GC load, improve performance, and optimize memory usage.
- Use profiling tools to verify their effects in production environments.
By understanding intrinsics and escape analysis, developers can write faster, more GC-efficient Java applications.
FAQ
1. What is the JVM memory model and why does it matter?
It ensures consistent visibility of memory between threads; optimizations like escape analysis must respect it.
2. How does G1 GC differ from CMS?
G1 is region-based with compaction; CMS was prone to fragmentation.
3. When should I use ZGC or Shenandoah?
For large heaps and ultra-low-latency requirements.
4. What are JVM safepoints and why do they matter?
They pause threads so JIT and GC can safely perform tasks.
5. How do I solve OutOfMemoryError in production?
Analyze heap dumps, tune heap flags, fix memory leaks.
6. What are the trade-offs of throughput vs latency tuning?
Throughput maximizes efficiency; latency ensures predictable responsiveness.
7. How do I read and interpret GC logs?
Look at heap before/after sizes, pause durations, and frequency.
8. How does JIT compilation optimize performance?
By compiling hot methods and applying optimizations like inlining and escape analysis.
9. What’s the future of GC in Java (Project Lilliput)?
Smaller object headers will improve escape analysis and reduce memory footprint.
10. How does GC differ in microservices vs monoliths?
Microservices emphasize predictable latency, while monoliths focus on throughput.
