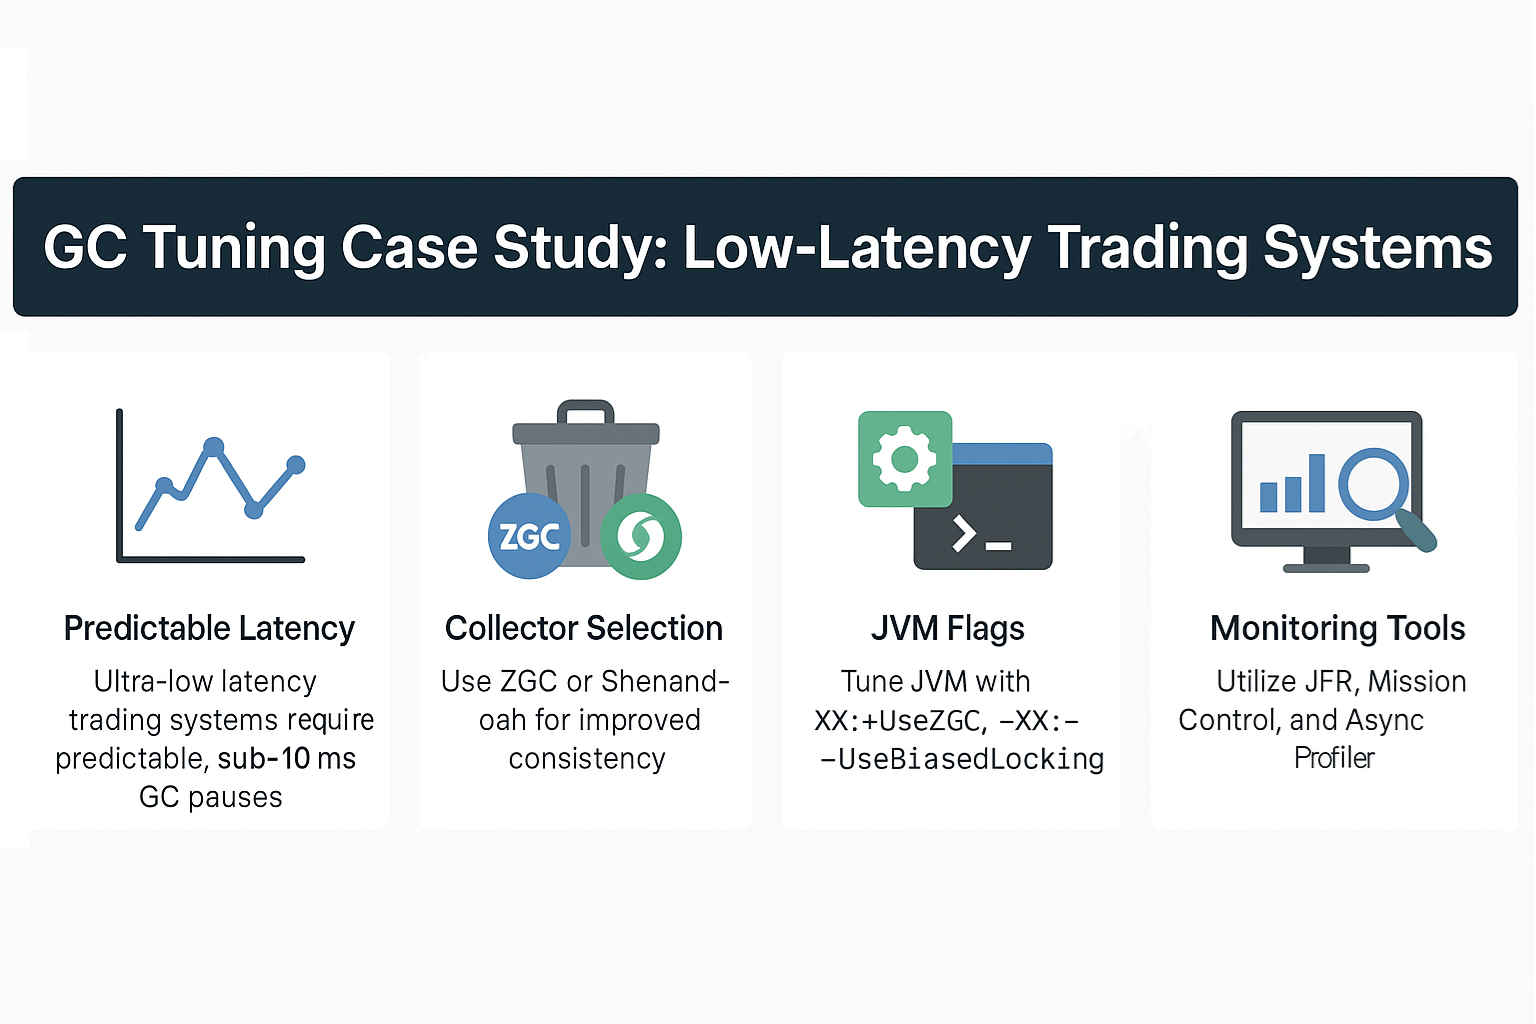
In high-frequency trading (HFT) and low-latency financial systems, every microsecond counts. Garbage Collection (GC) pauses—even a few milliseconds—can mean missed trades or financial losses. Unlike batch systems where throughput dominates, trading systems demand predictable, ultra-low latency.
This case study explores how GC tuning is applied to low-latency trading systems, focusing on choosing the right collector, JVM tuning flags, and monitoring techniques to keep GC pauses under strict SLAs.
JVM and GC in Low-Latency Systems
- JVM Benefits: Safety, productivity, mature ecosystem.
- Challenge: Default GC may introduce unpredictable pauses.
- Solution: Advanced collectors (ZGC, Shenandoah) + precise tuning.
Analogy: In trading, JVM is the racetrack, GC is the pit stop. The faster and more predictable the pit stop, the more competitive the race.
GC Fundamentals in Trading Systems
- Throughput vs Latency: Trading systems prioritize latency consistency.
- Generational GC: Still applies, but pause times must be minimized.
- Safepoints: Critical to understand since they halt all threads.
Collector Choices for Low Latency
G1 GC
- Strengths: Predictable, region-based compaction.
- Weaknesses: Pauses scale with heap size.
- Use Case: Medium-latency financial applications.
ZGC
- Strengths: Sub-10ms pause times, heap sizes up to terabytes.
- Weaknesses: Higher memory overhead.
- Use Case: Ultra-low latency, large heap trading engines.
Shenandoah
- Strengths: Concurrent compaction, pause times independent of heap.
- Weaknesses: CPU intensive.
- Use Case: Similar to ZGC, often chosen in Red Hat/OpenJDK ecosystems.
Case Study: Trading Engine GC Tuning
System Requirements
- Latency SLA: <5ms for 99.9% of transactions.
- Heap size: 32 GB.
- Allocation rate: Very high (market data ingestion).
Initial Setup
- JVM Default: G1 GC.
- Observation: Latency spikes up to 100ms under load.
Step 1: Move to ZGC
-XX:+UseZGC -Xms32g -Xmx32g -XX:+AlwaysPreTouch
- Result: Pauses reduced to <5ms.
- Observation: CPU overhead increased slightly.
Step 2: Optimize Allocation
- Reduced short-lived object churn.
- Used object pooling for market data parsing.
- Reduced GC frequency.
Step 3: Monitor with JFR + Mission Control
- Identified safepoint bias due to biased lock revocation.
- Disabled biased locking:
-XX:-UseBiasedLocking
Final Outcome
- 99.9% latencies within SLA.
- GC no longer bottleneck in transaction pipeline.
Monitoring and Tools
- Java Flight Recorder (JFR): Tracks safepoints, GC events.
- Mission Control: Visualization of latency patterns.
- Async Profiler: Allocation and lock profiling.
Pitfalls in Low-Latency GC Tuning
- Over-Tuning: Excessive flags can destabilize.
- Ignoring Safepoints: Even non-GC safepoints cause pauses.
- High Allocation Rates: Object churn increases GC load.
- Framework Overhead: Reflection and proxies cause megamorphic inline caches, triggering deoptimizations.
Best Practices for Low-Latency GC
- Use ZGC or Shenandoah for trading workloads.
- Fix allocation hotspots in hot loops.
- Disable biased locking in latency-critical systems.
- Monitor safepoints along with GC.
- Benchmark in production-like environments.
JVM Version Tracker
- Java 8: Limited to CMS/G1, not ideal for low latency.
- Java 11: G1 default, ZGC experimental.
- Java 17: ZGC + Shenandoah production-ready.
- Java 21+: NUMA-aware GC, Project Lilliput improving object headers.
Conclusion & Key Takeaways
- Low-latency systems prioritize predictable pause times over throughput.
- ZGC and Shenandoah are the best options for trading workloads.
- GC tuning must go hand-in-hand with allocation reduction and safepoint monitoring.
- Tools like JFR, Mission Control, and async-profiler are essential for validation.
FAQ
1. What is the JVM memory model and why does it matter?
It ensures consistency across threads in latency-sensitive applications.
2. How does G1 GC differ from CMS?
G1 uses regions and compaction; CMS fragmented memory.
3. When should I use ZGC or Shenandoah?
In workloads where latency SLAs are strict, often in trading or telecom.
4. What are JVM safepoints and why do they matter?
They halt threads for GC or deopt; in trading systems, they must be minimized.
5. How do I solve OutOfMemoryError in production?
Tune heap, reduce allocation churn, and analyze GC logs.
6. What are the trade-offs of throughput vs latency tuning?
Throughput collectors maximize efficiency; latency collectors minimize pause times.
7. How do I read and interpret GC logs?
Look at pause durations, GC frequency, and safepoint bias.
8. How does JIT compilation optimize performance?
By inlining and using escape analysis, reducing allocations.
9. What’s the future of GC in Java (Project Lilliput)?
Smaller object headers improve memory density and GC efficiency.
10. How does GC differ in microservices vs monoliths?
Microservices require low latency per request; monoliths prioritize throughput.
