
Introduction to the Java Virtual Machine: How Java Runs Anywhere
Learn how the Java Virtual Machine (JVM) enables Java to run anywhere. Explore JVM architecture, memory model, JIT compiler, and garbage collection
Browse the complete Jvm Internals Garbage Collection tutorial series with example-driven, step-by-step guides.

Learn how the Java Virtual Machine (JVM) enables Java to run anywhere. Explore JVM architecture, memory model, JIT compiler, and garbage collection

Deep dive into JVM architecture: class loader, runtime data areas, and execution engine. Learn how the JVM powers Java performance and portability

Learn the differences between JVM, JRE, and JDK in Java. Understand their roles, architecture, and importance for developers in building reliable apps

Understand JVM class loading: how .class files are loaded, verified, and executed. Learn JVM internals, memory model, execution flow, and tuning insights

Learn JVM bytecode: the low-level language that powers Java execution. Explore instructions, architecture, JIT optimizations, and real-world performance

Dive deep into JVM runtime data areas: stack, heap, and method area. Learn memory management, garbage collection, tuning, and performance optimization

Beginner’s guide to the JVM instruction set. Learn how Java bytecode executes inside the JVM, stack-based operations, JIT optimizations, and performance tuning

Learn how the JVM interprets and JIT-compiles bytecode for execution. Understand JVM internals, JIT optimizations, performance tuning, and real-world use cases

Learn JVM memory model internals: heap, stack, and beyond. Explore memory areas, GC behavior, tuning, and performance best practices for Java developers

Learn how Java threads work in the JVM, including stack frames, execution model, synchronization, and performance tuning for production-ready applications

Master the Java Memory Model (JMM): happens-before rules, synchronization guarantees, visibility, atomicity, and best practices for multithreaded Java apps
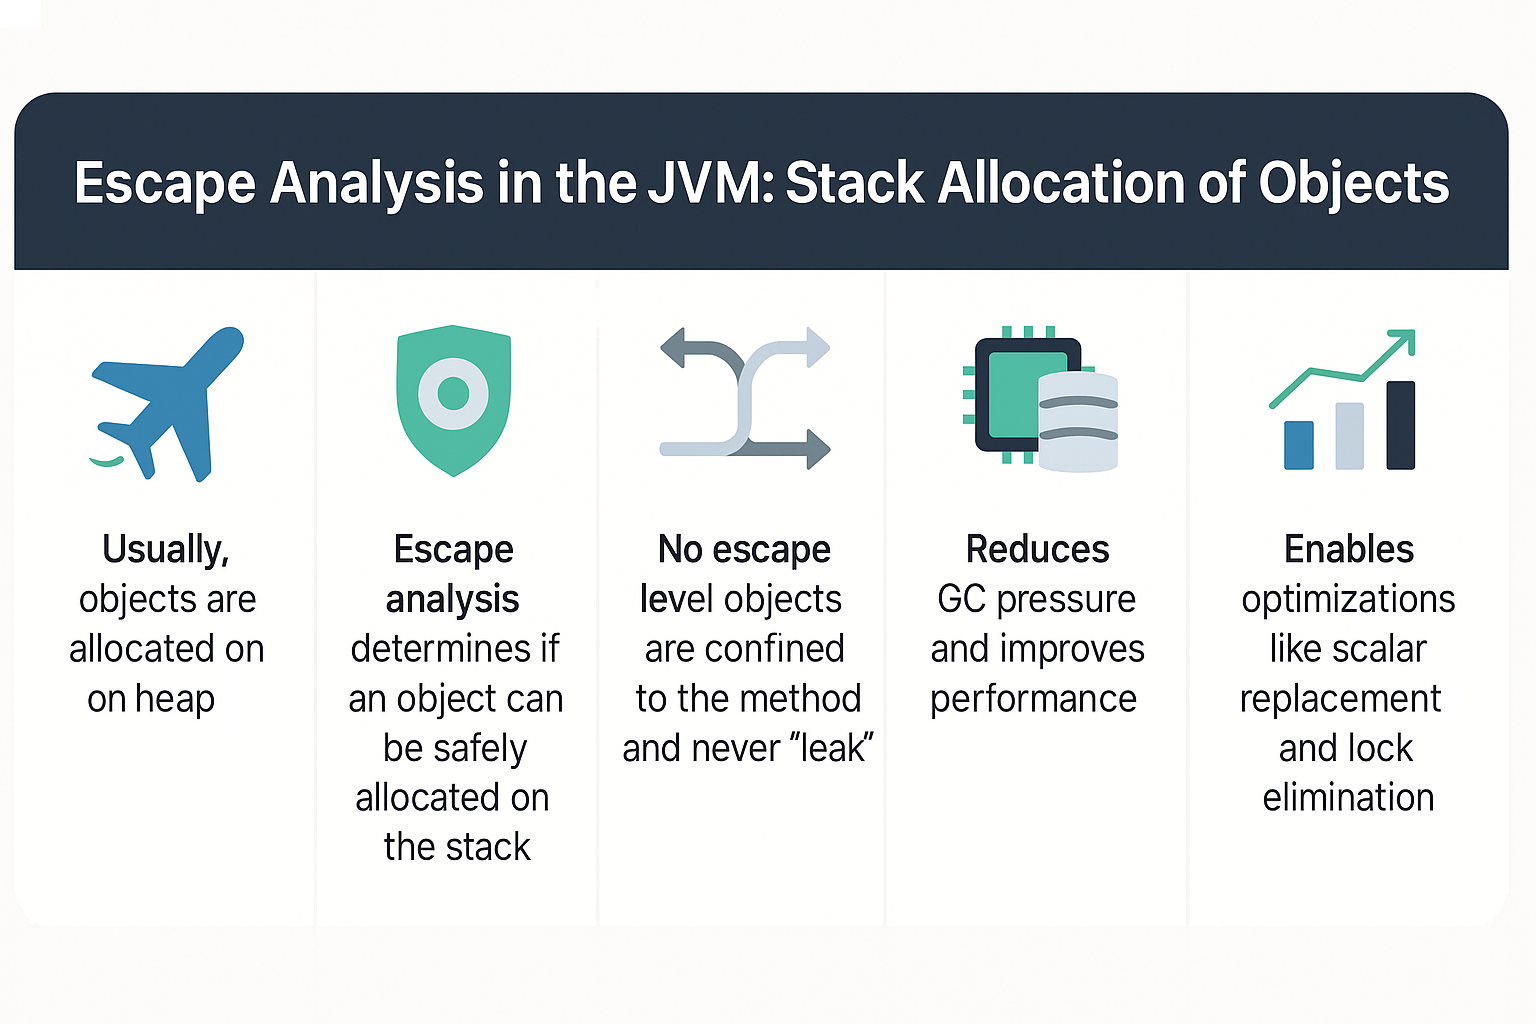
Learn how JVM escape analysis enables stack allocation of objects, reducing GC pressure, improving performance, and optimizing memory in Java applications
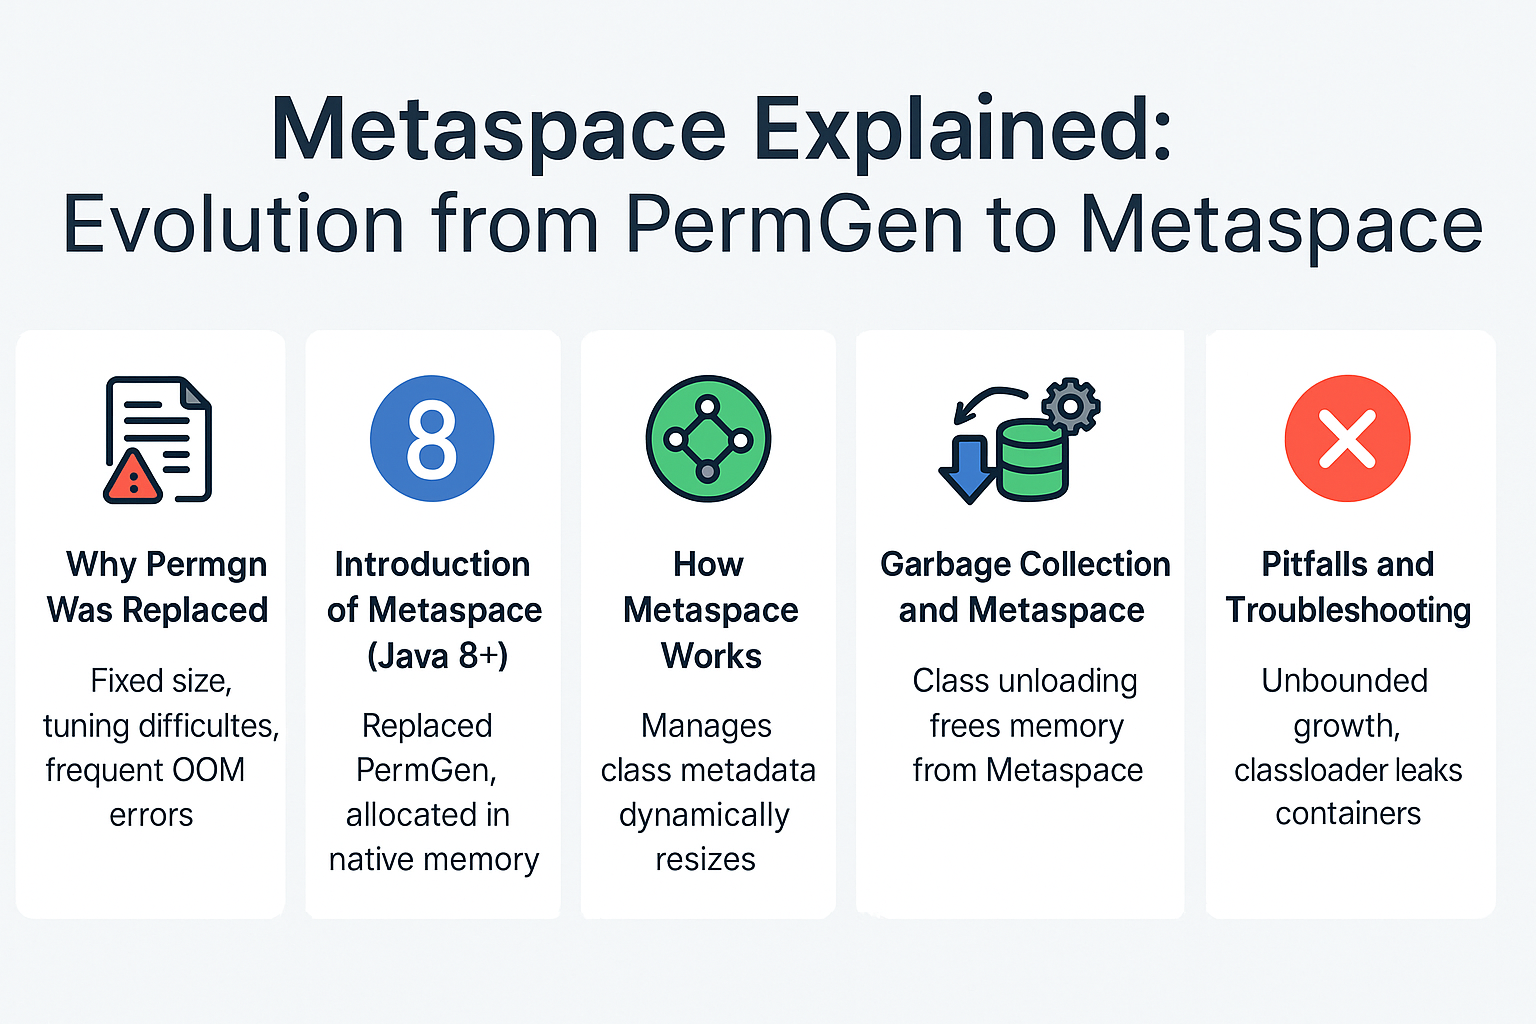
Understand the evolution from PermGen to Metaspace in the JVM. Learn why PermGen was replaced, how Metaspace works, and tuning strategies for production apps
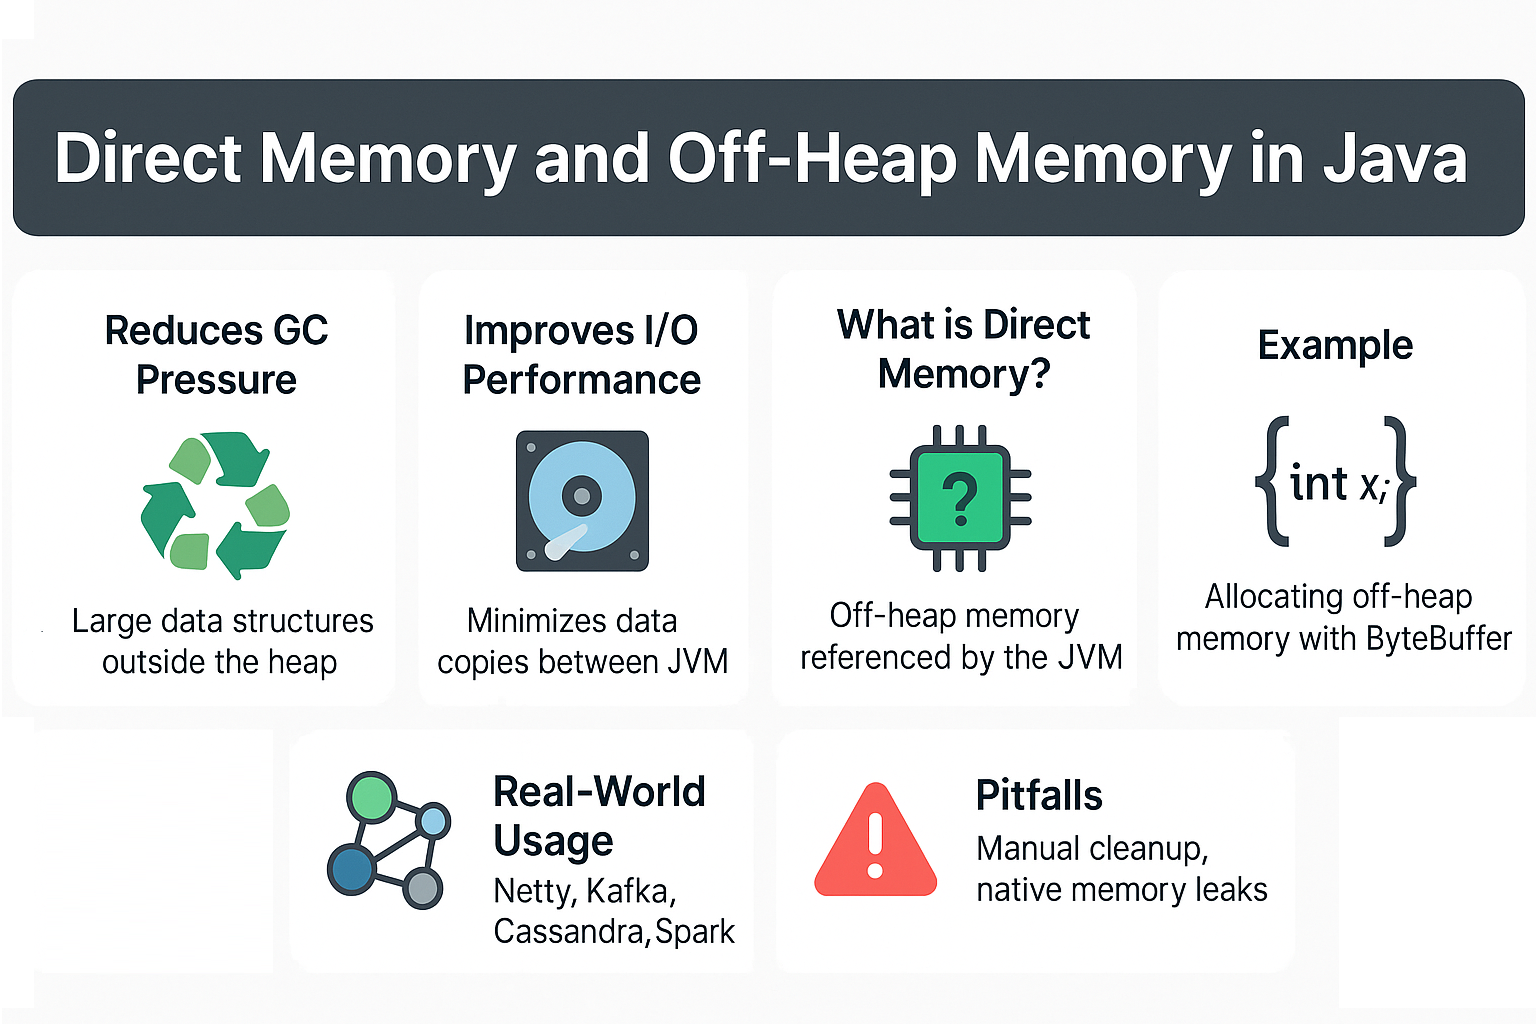
Learn about direct memory and off-heap memory in Java. Explore how they work, benefits, pitfalls, JVM tuning, and real-world performance optimizations
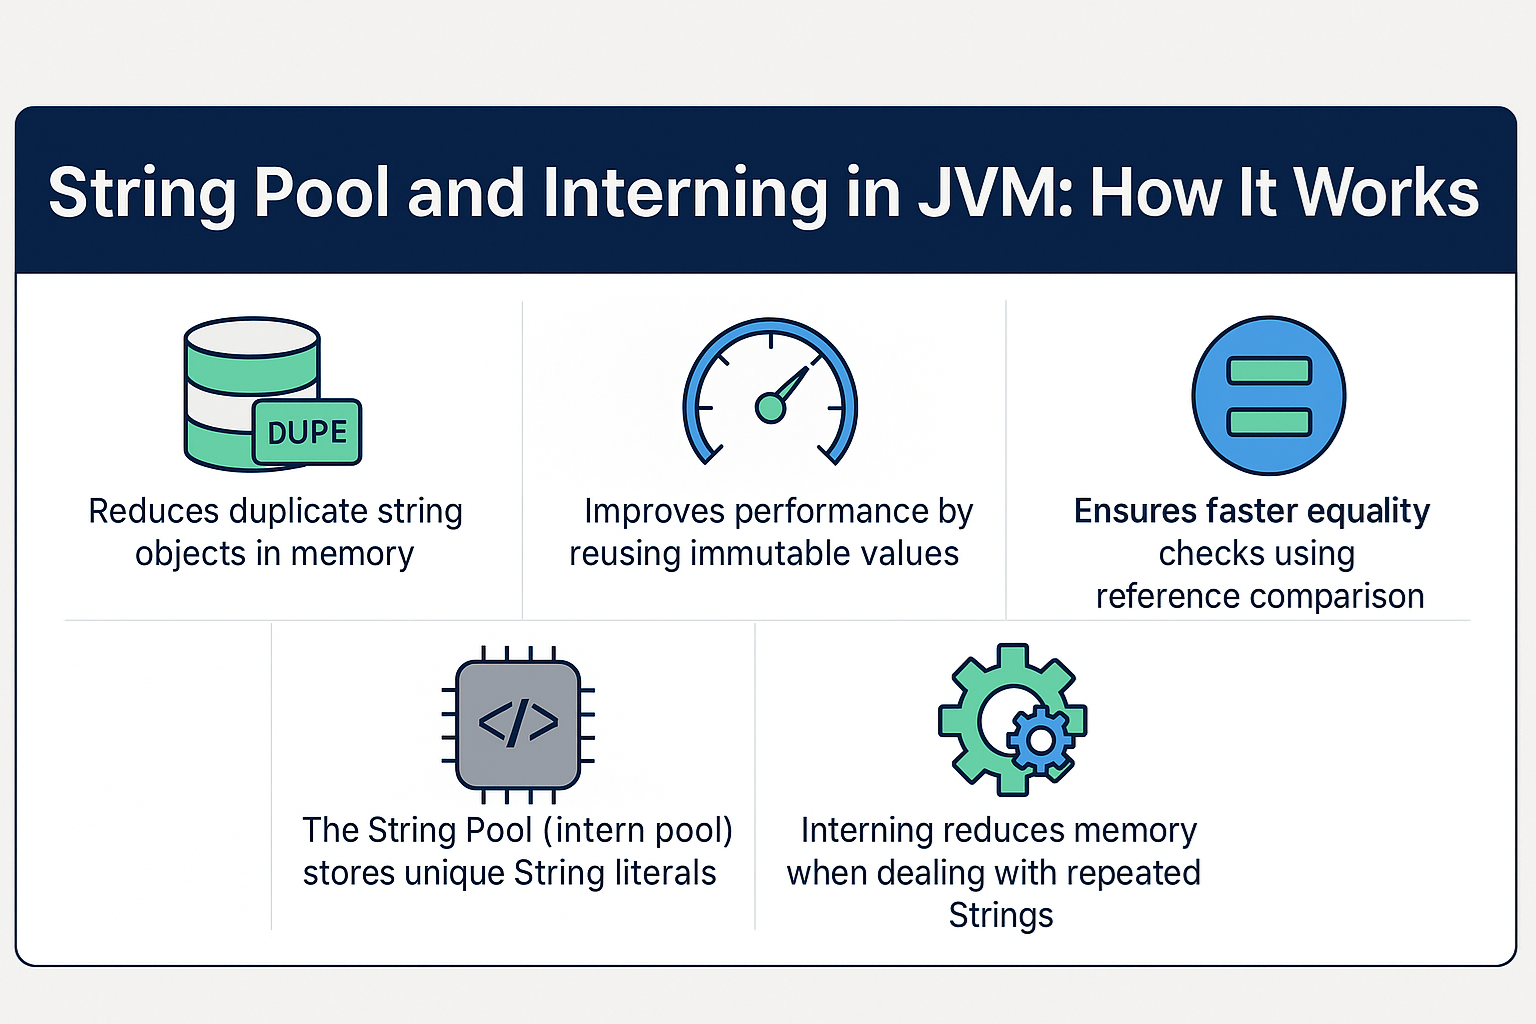
Learn how the JVM string pool and interning work. Explore memory optimization, performance benefits, pitfalls, and best practices for Java developers
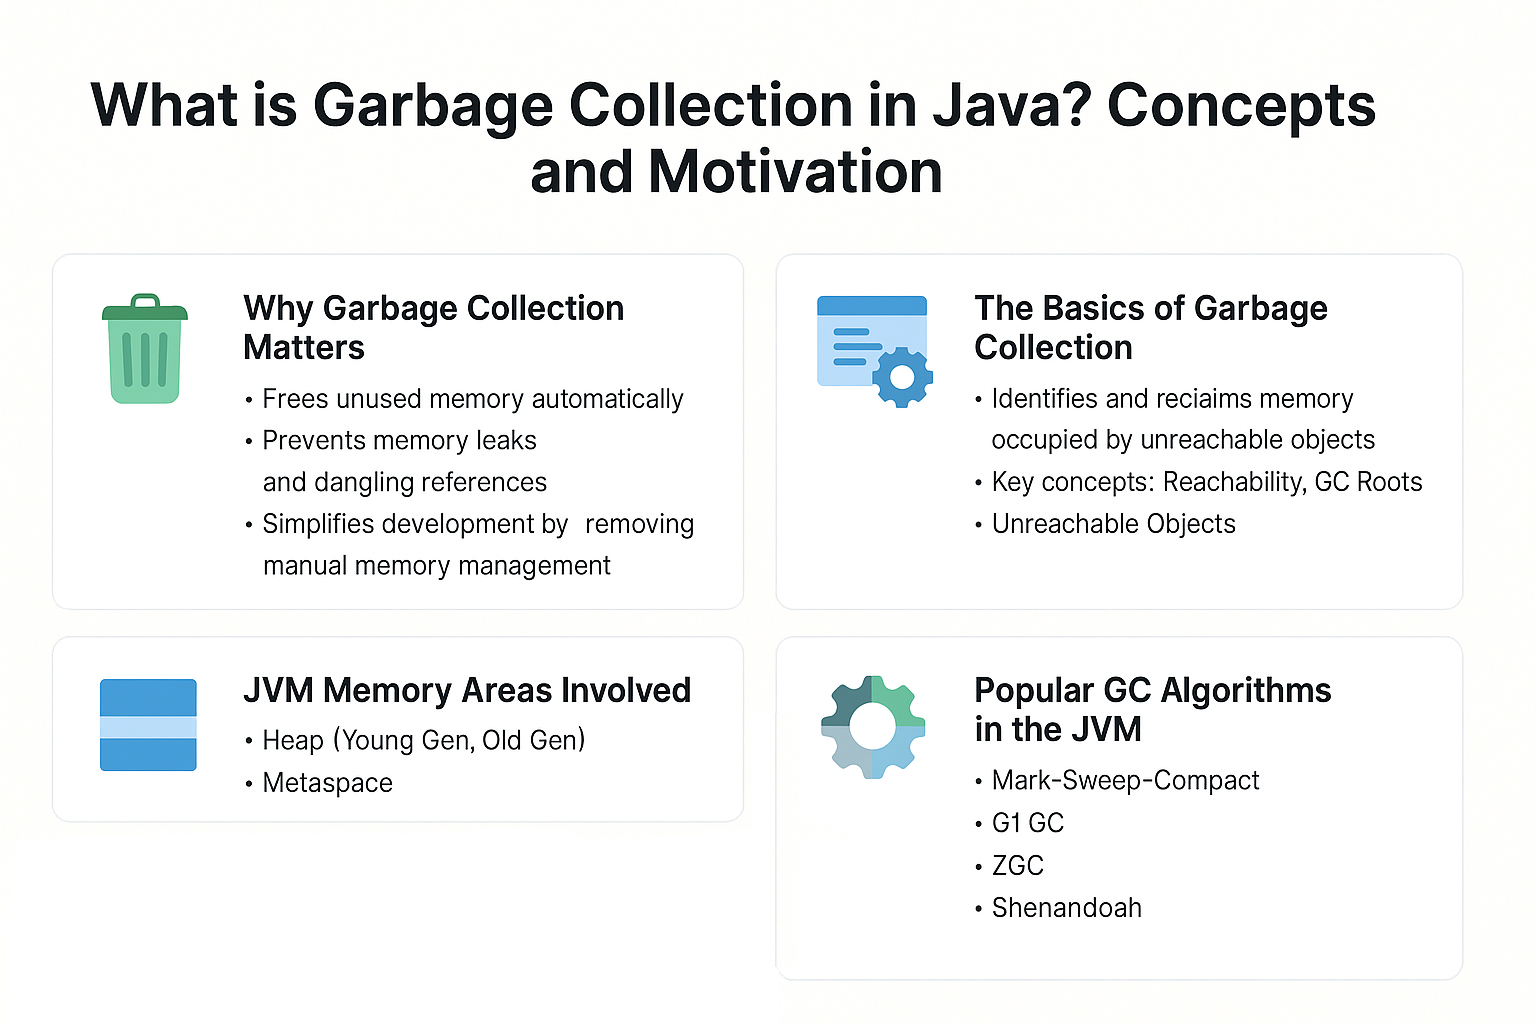
Understand Java garbage collection: concepts, motivation, algorithms, tuning, and best practices to optimize performance and memory efficiency in JVM apps
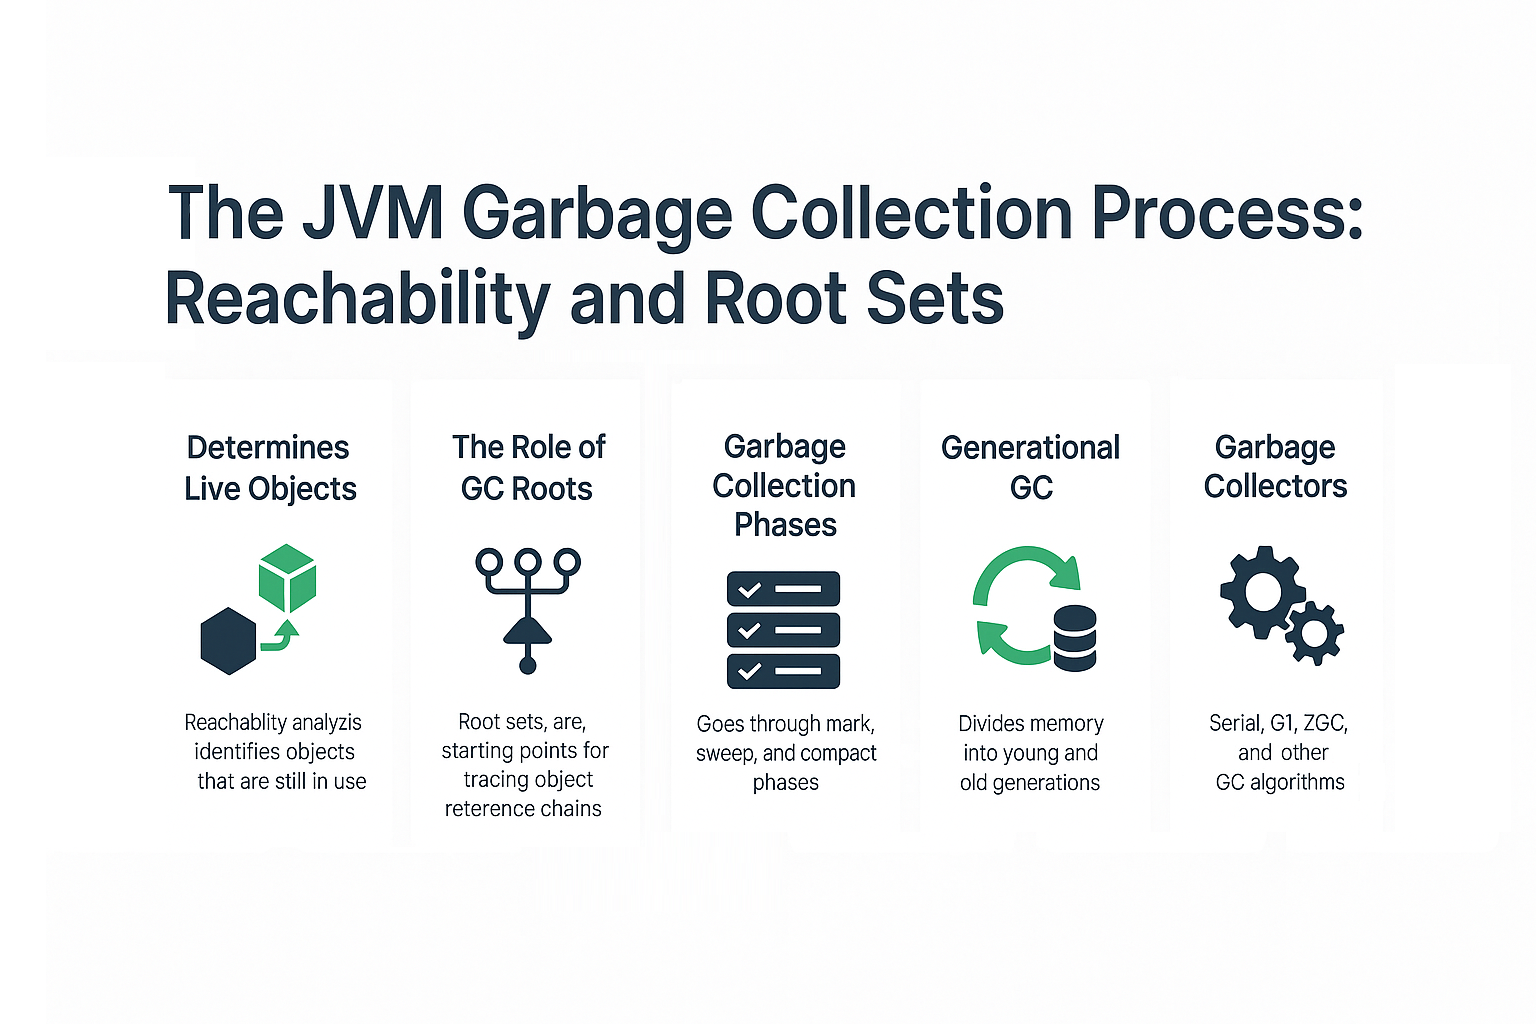
Learn how JVM garbage collection works through reachability analysis and root sets. Understand GC fundamentals, algorithms, tuning, and best practices
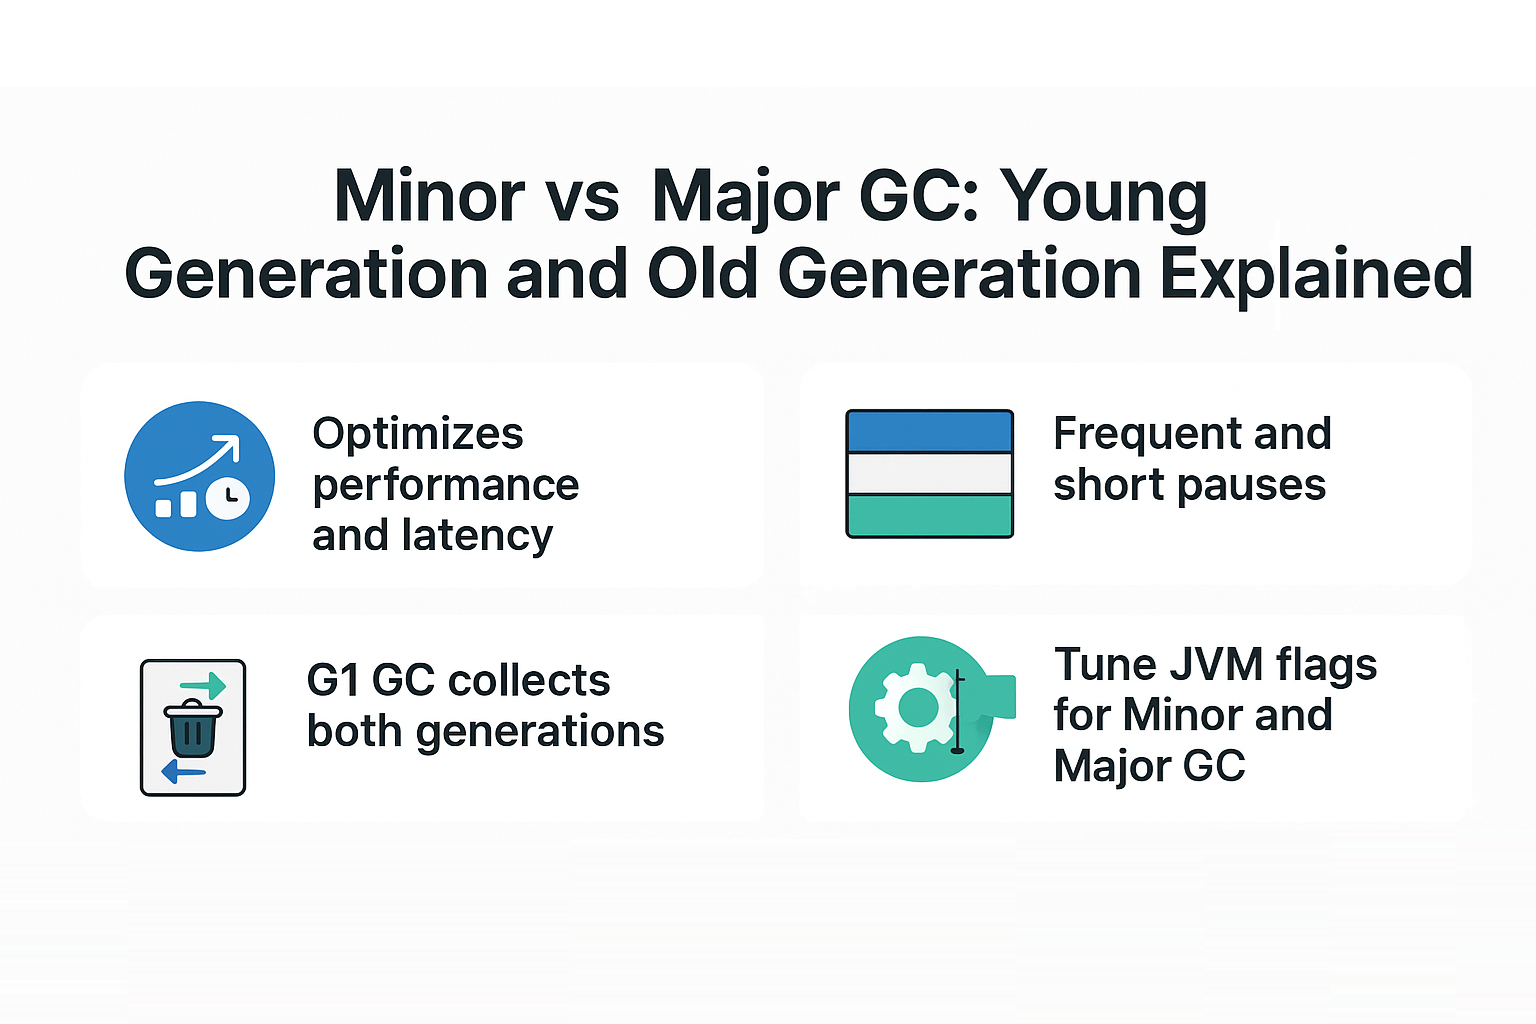
Learn the differences between Minor and Major Garbage Collection in Java. Explore young vs old generation, GC algorithms, tuning, and performance tips
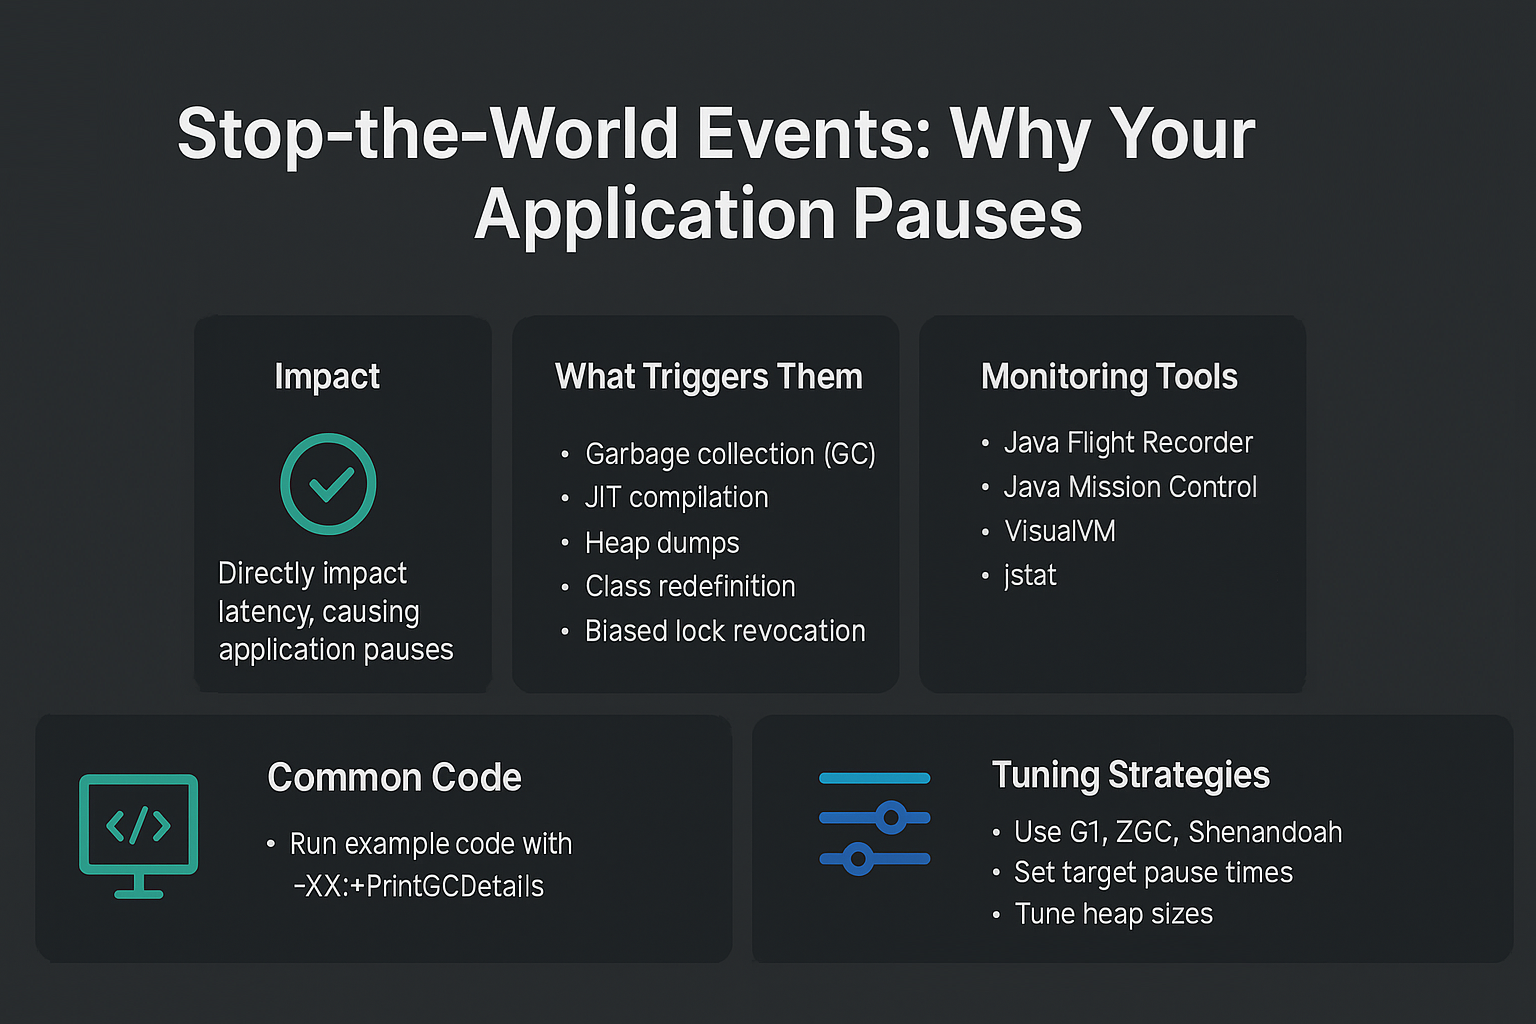
Understand Stop-the-World events in the JVM. Learn why applications pause, how GC triggers them, performance impacts, and tuning strategies to reduce latency
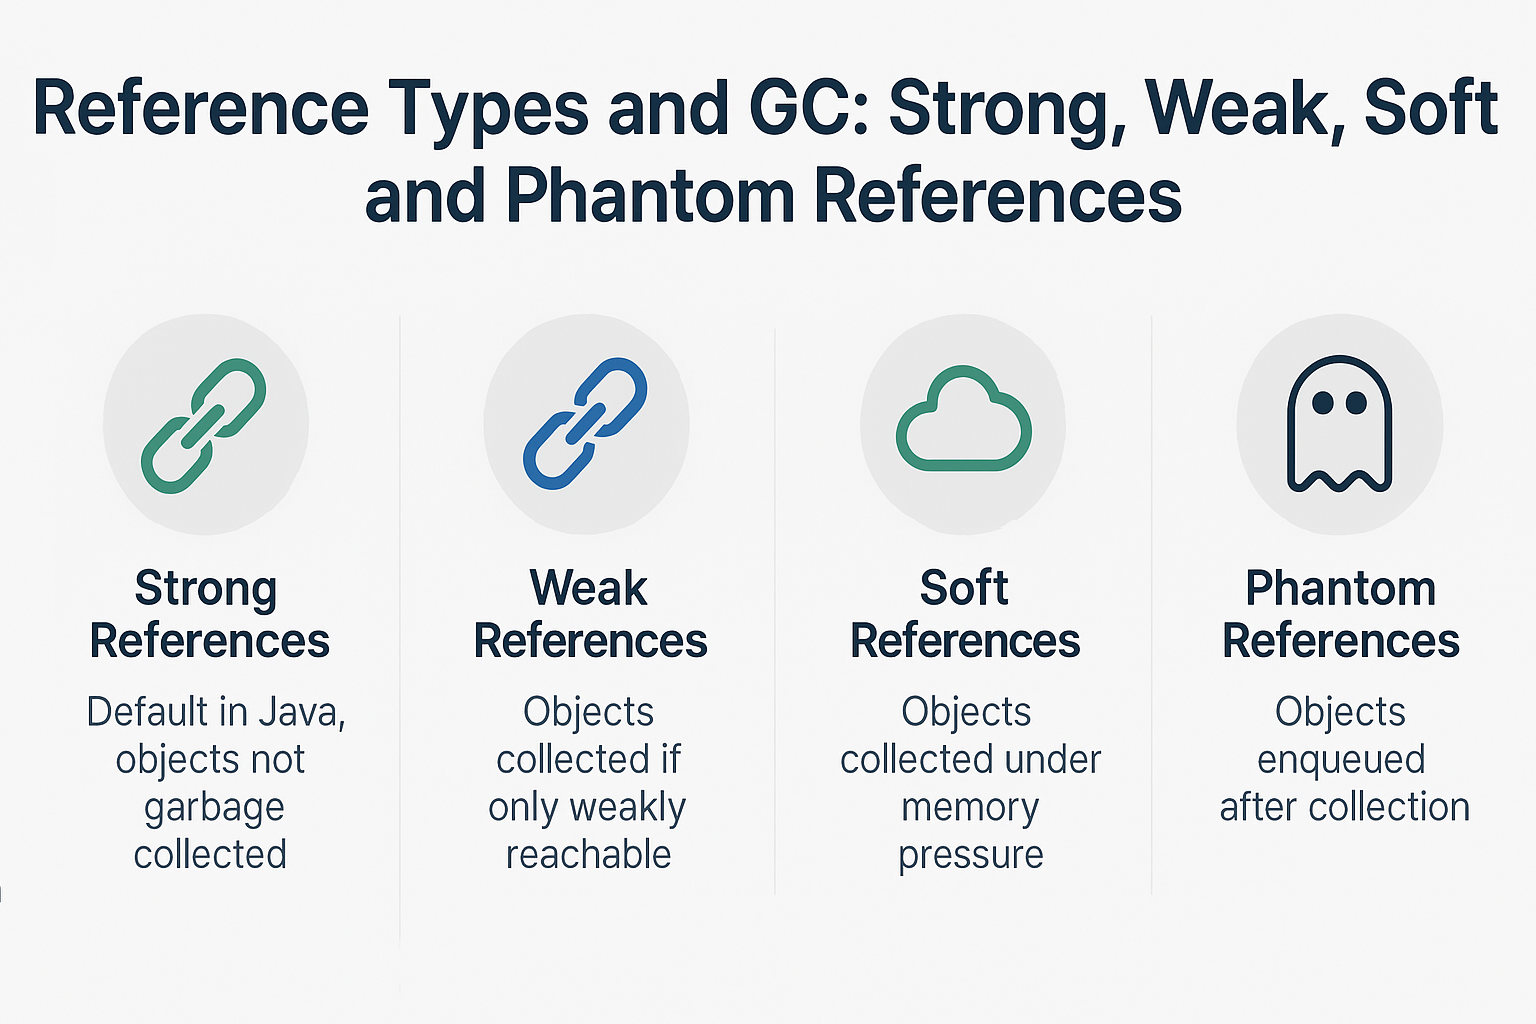
Understand strong, weak, soft, and phantom references in Java. Learn their role in JVM garbage collection, memory optimization, and real-world use cases
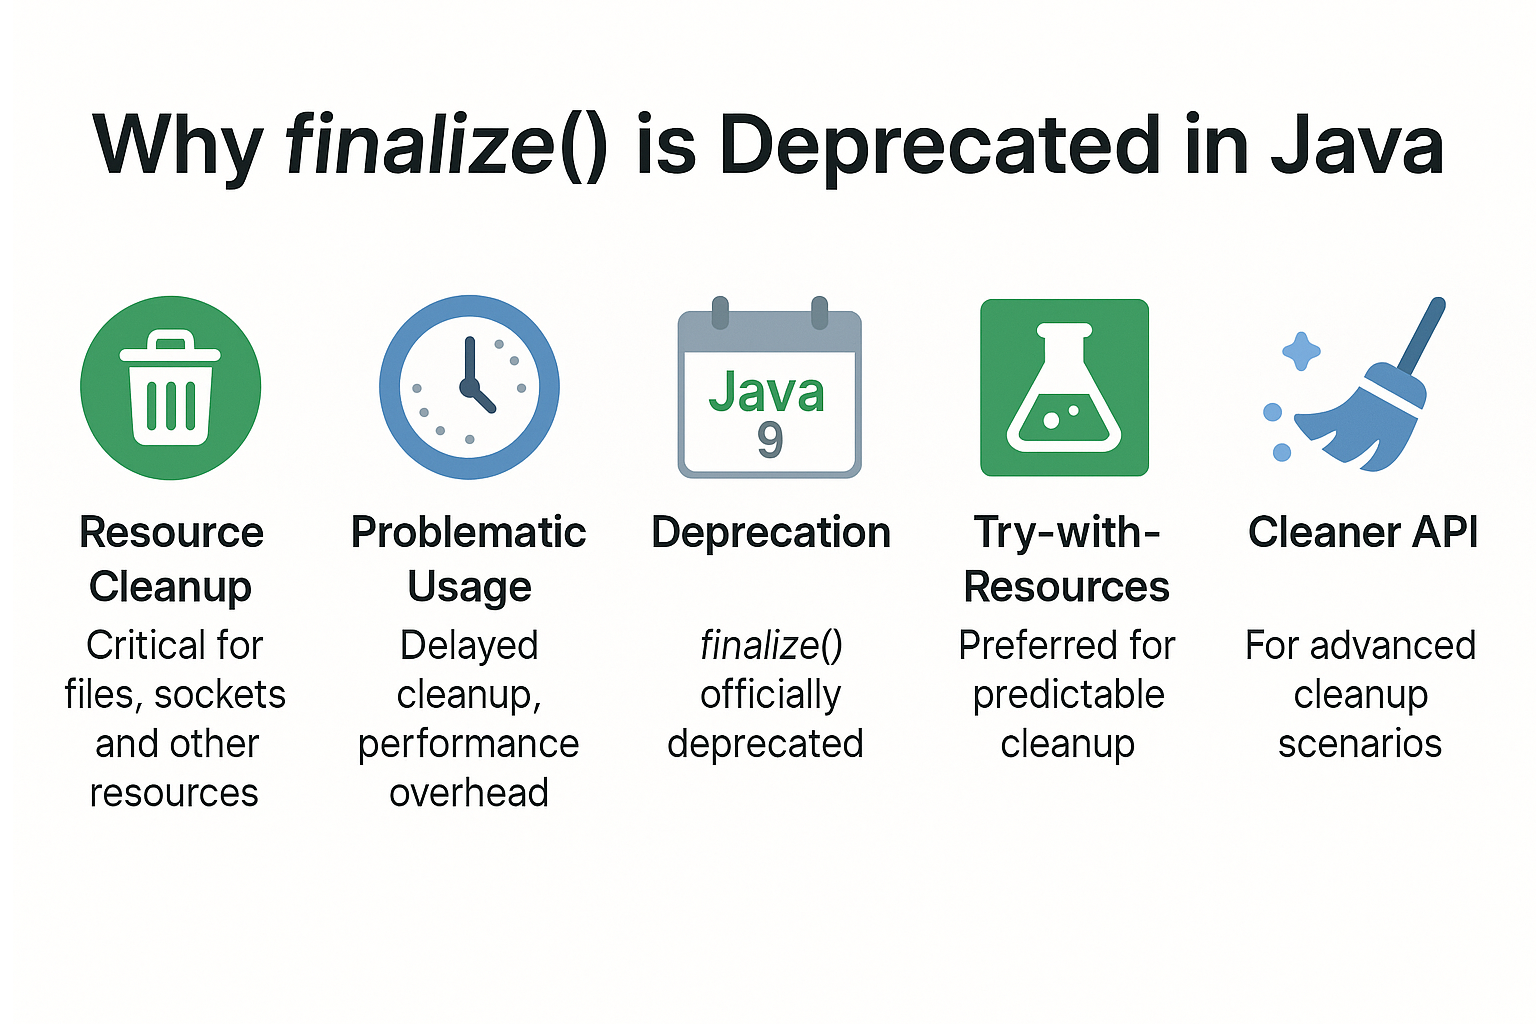
Learn why finalize() is deprecated in Java, the problems it caused, and modern alternatives like try-with-resources, AutoCloseable, and Cleaner API
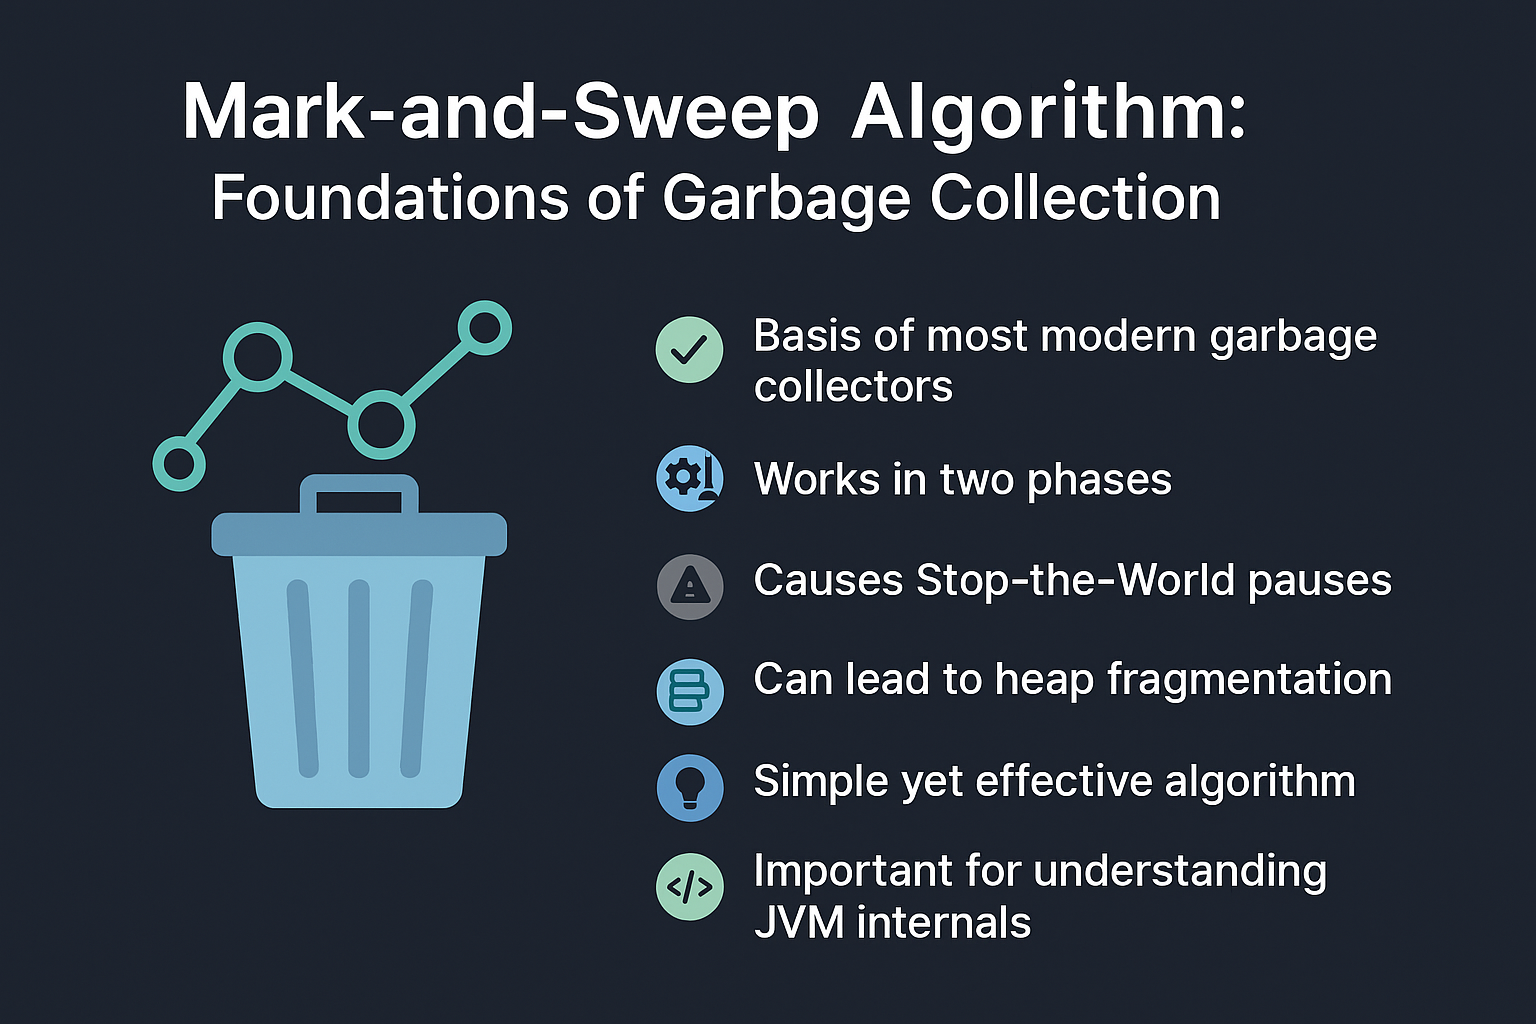
Learn the Mark-and-Sweep algorithm in Java Garbage Collection. Understand its process, pros, cons, and role in JVM memory management
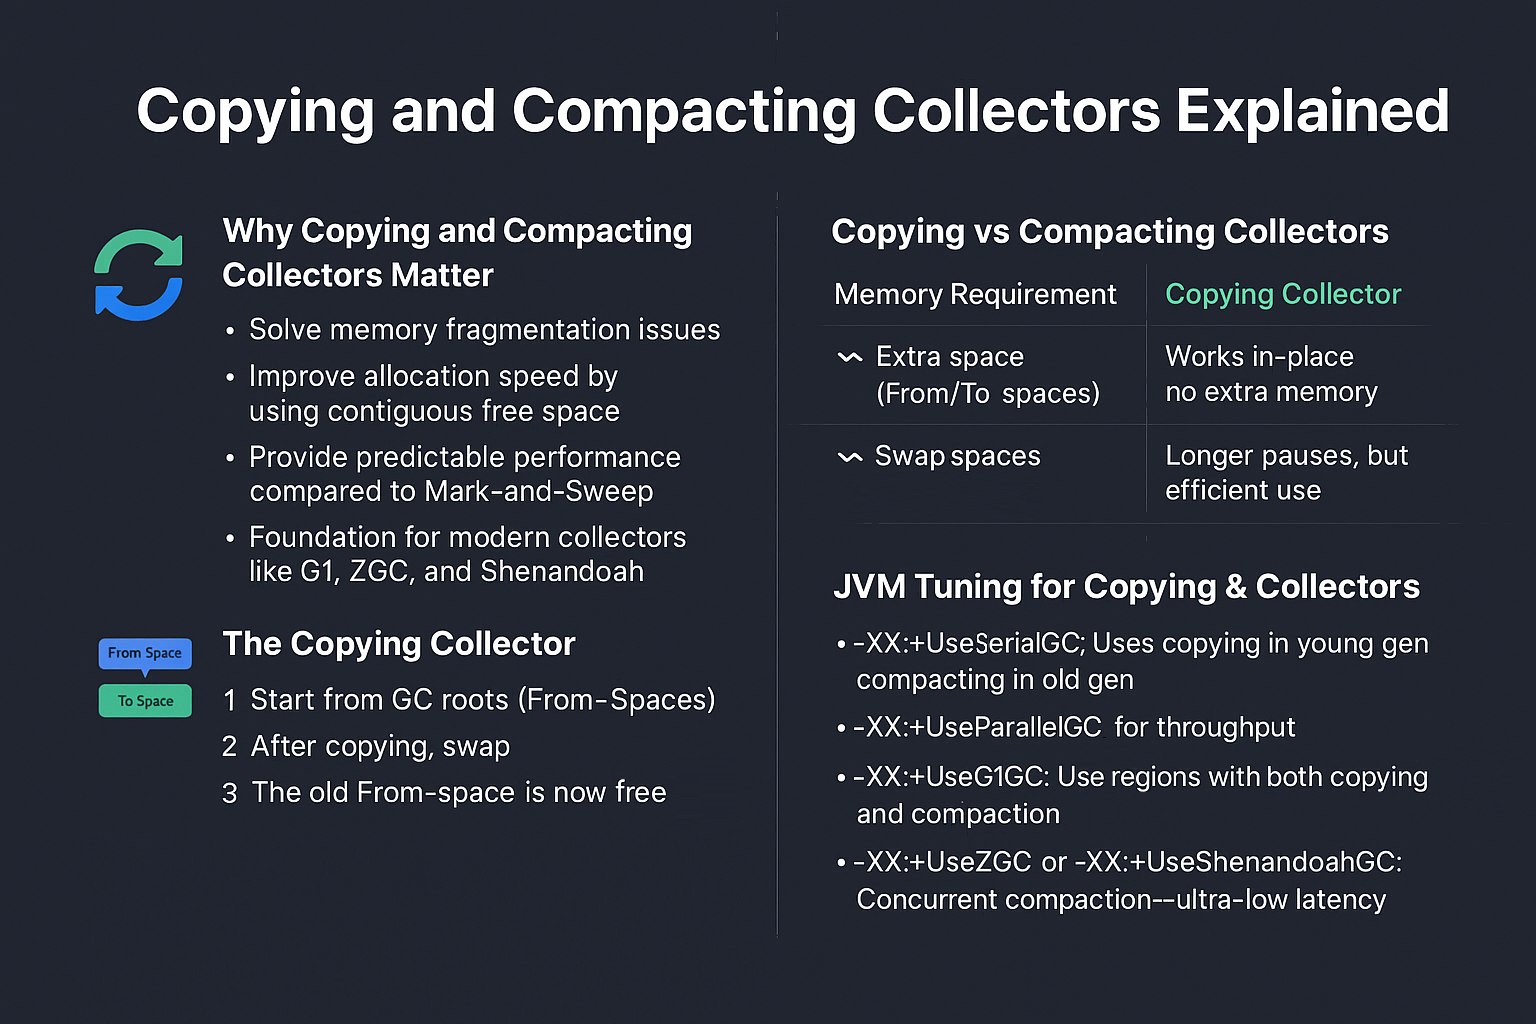
Understand copying and compacting collectors in Java GC. Learn how they reduce fragmentation, improve memory efficiency, and impact JVM performance
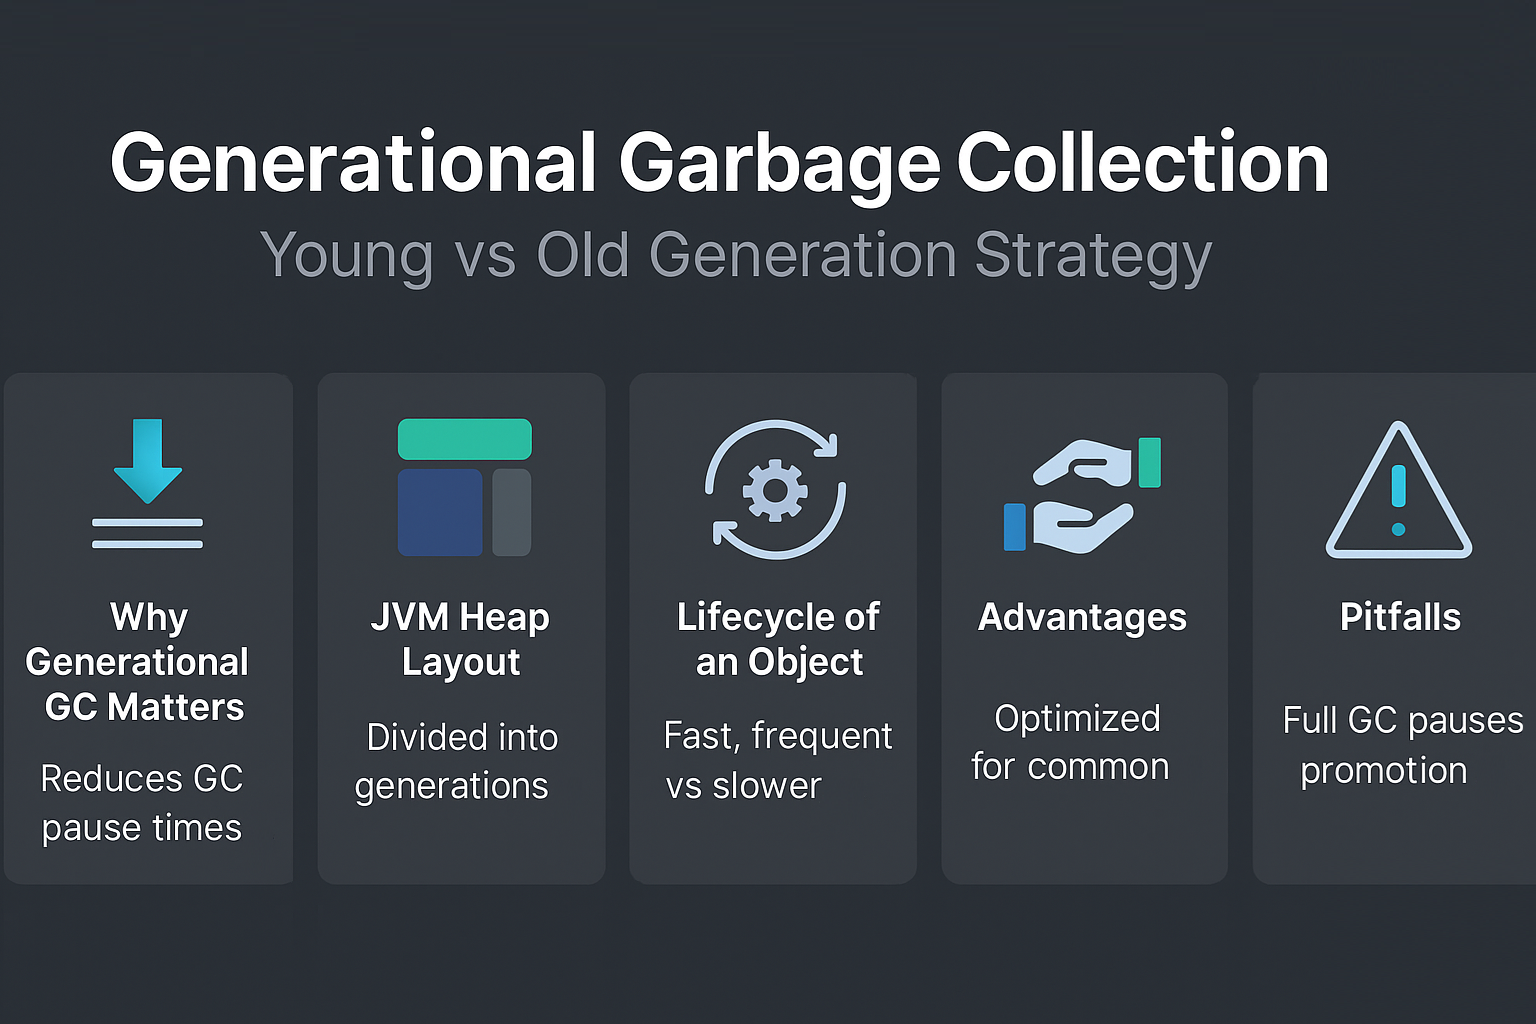
Understand Generational Garbage Collection in Java. Learn how Young and Old Generations optimize JVM performance, memory efficiency, and GC tuning
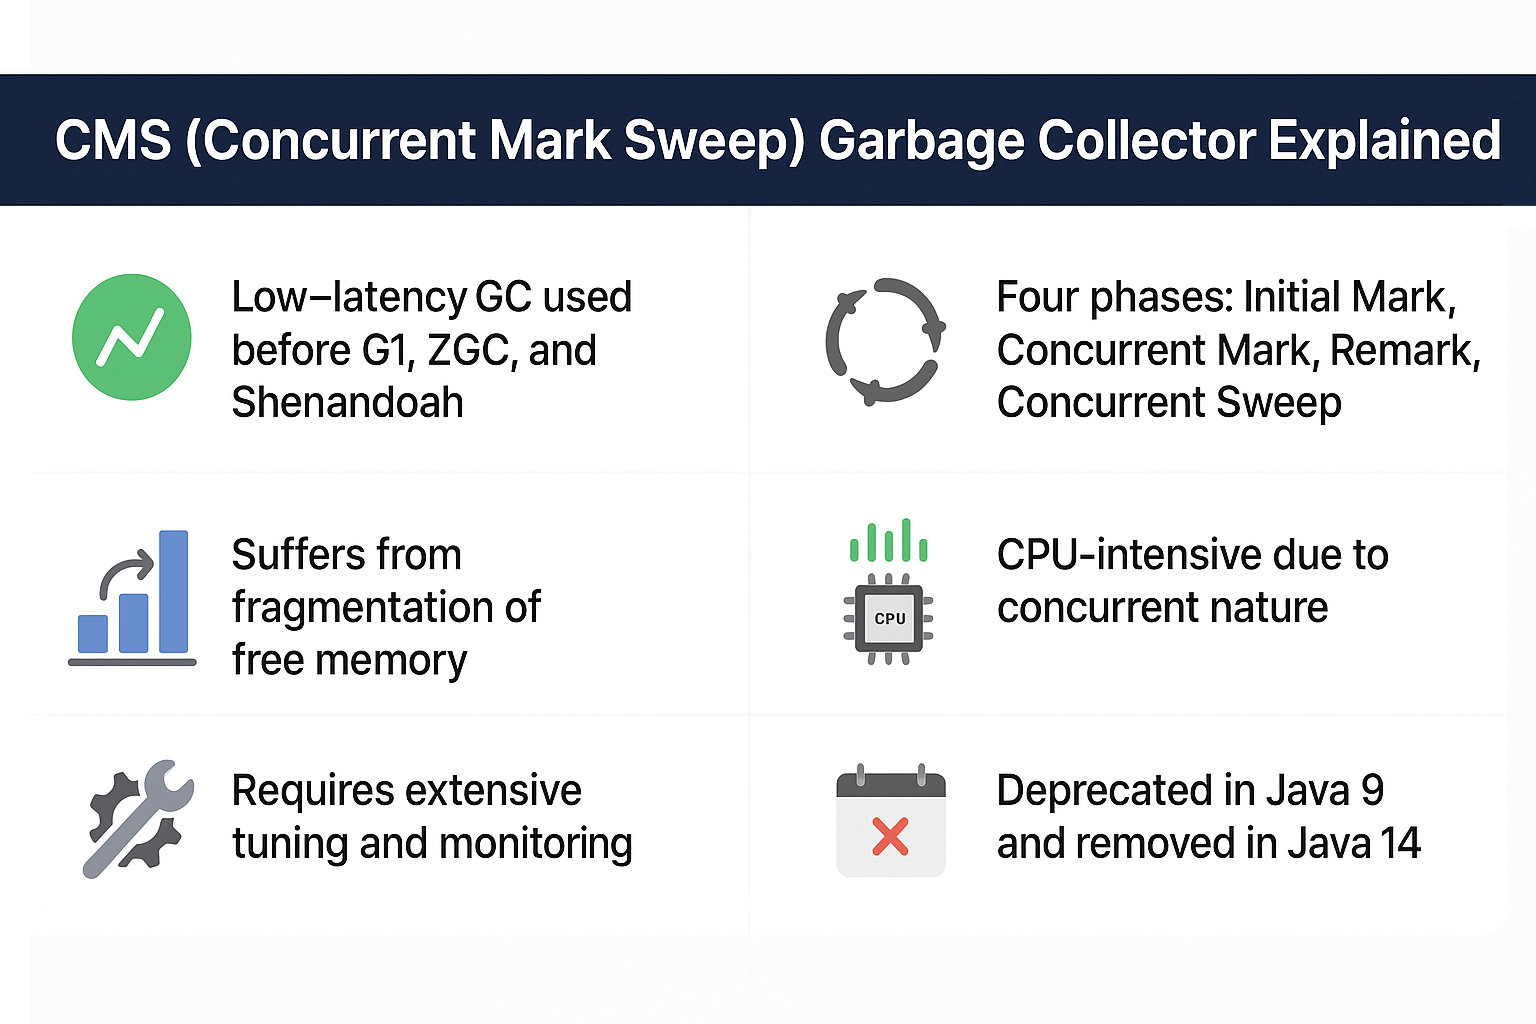
Learn the CMS Garbage Collector in Java. Understand its phases, strengths, weaknesses, and why it was deprecated in favor of G1, ZGC, and Shenandoah
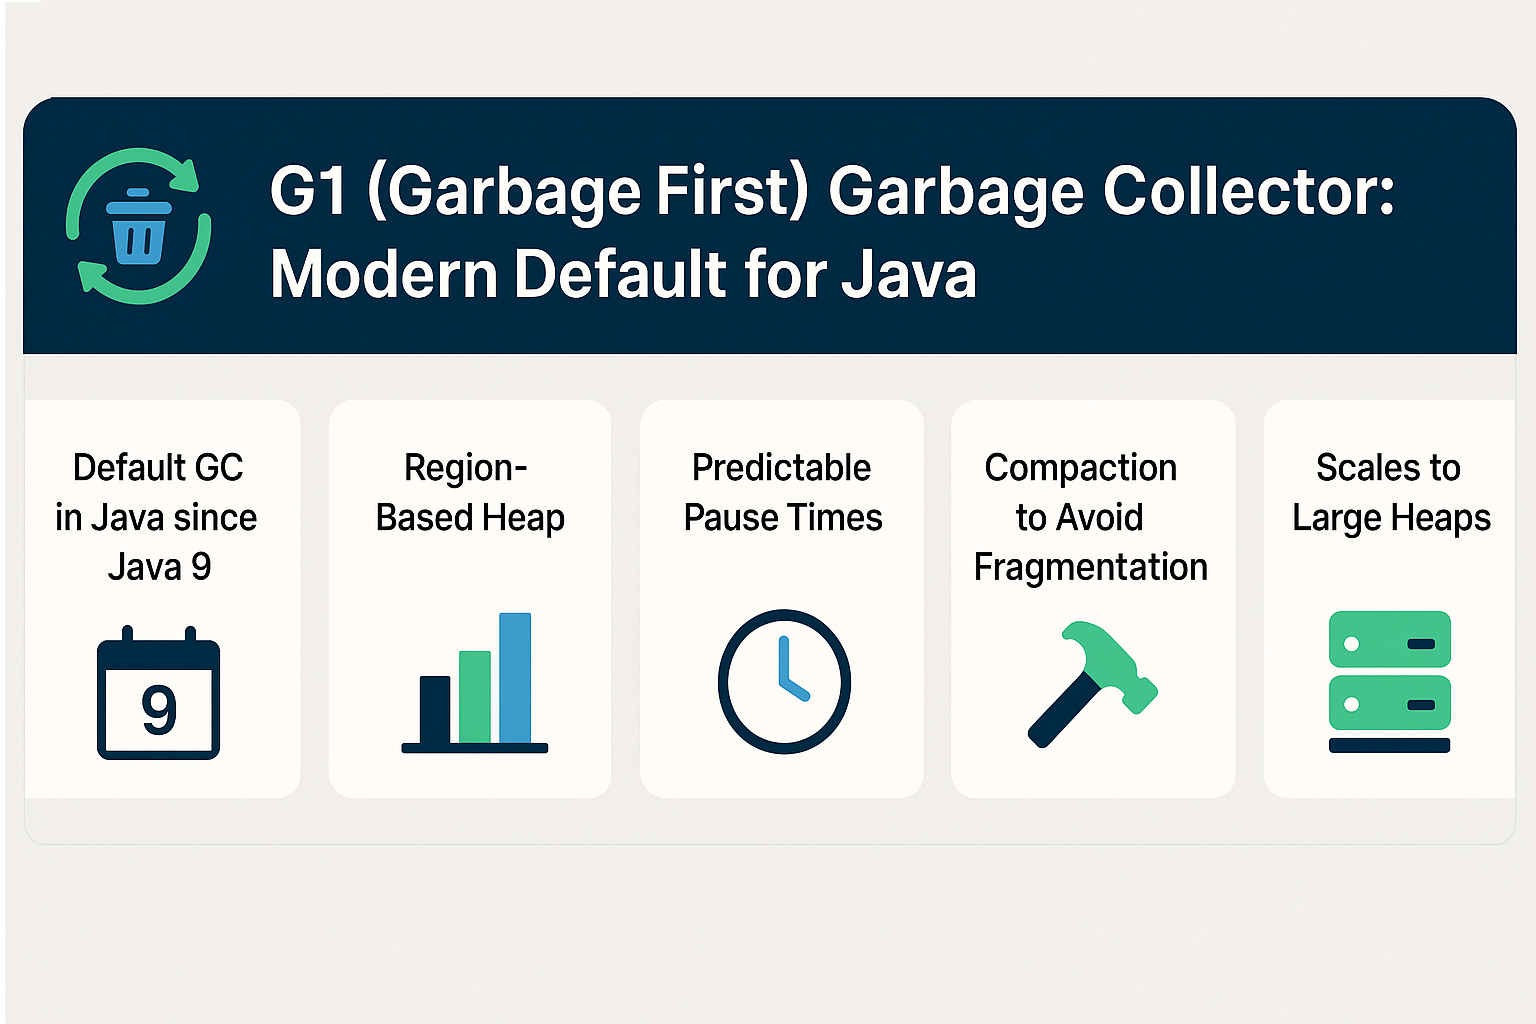
Learn G1 Garbage Collector in Java. Explore its region-based design, tuning options, advantages over CMS, and why it’s the modern JVM default
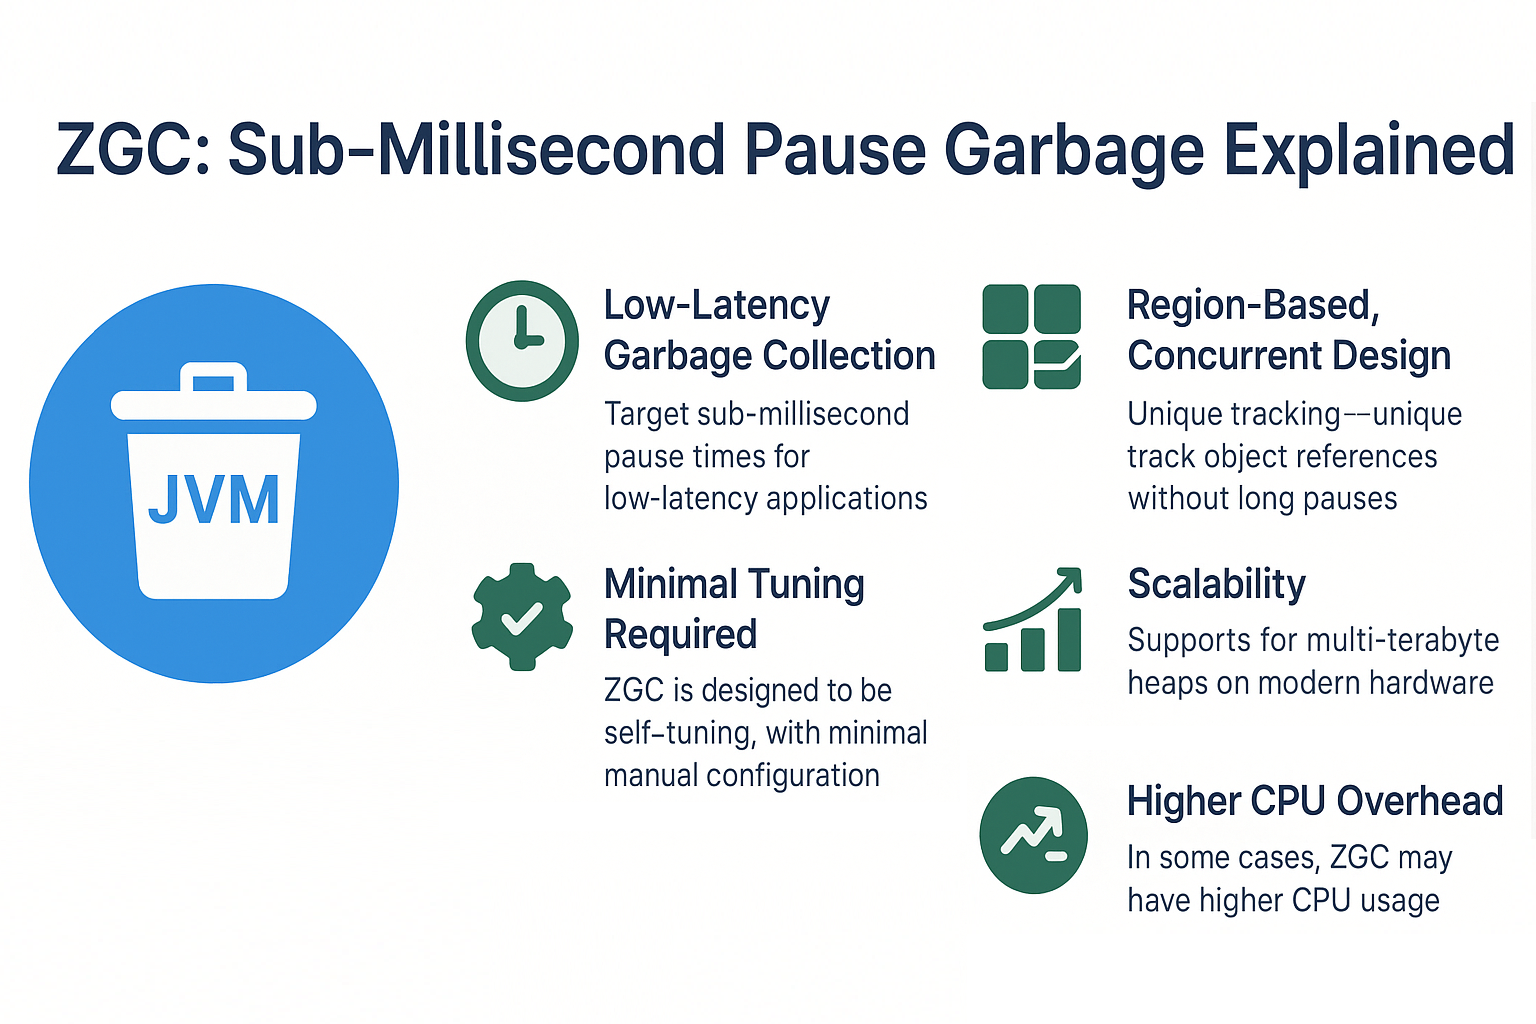
Learn ZGC in Java: a low-latency garbage collector with sub-millisecond pause times. Explore its design, tuning options, and real-world use cases
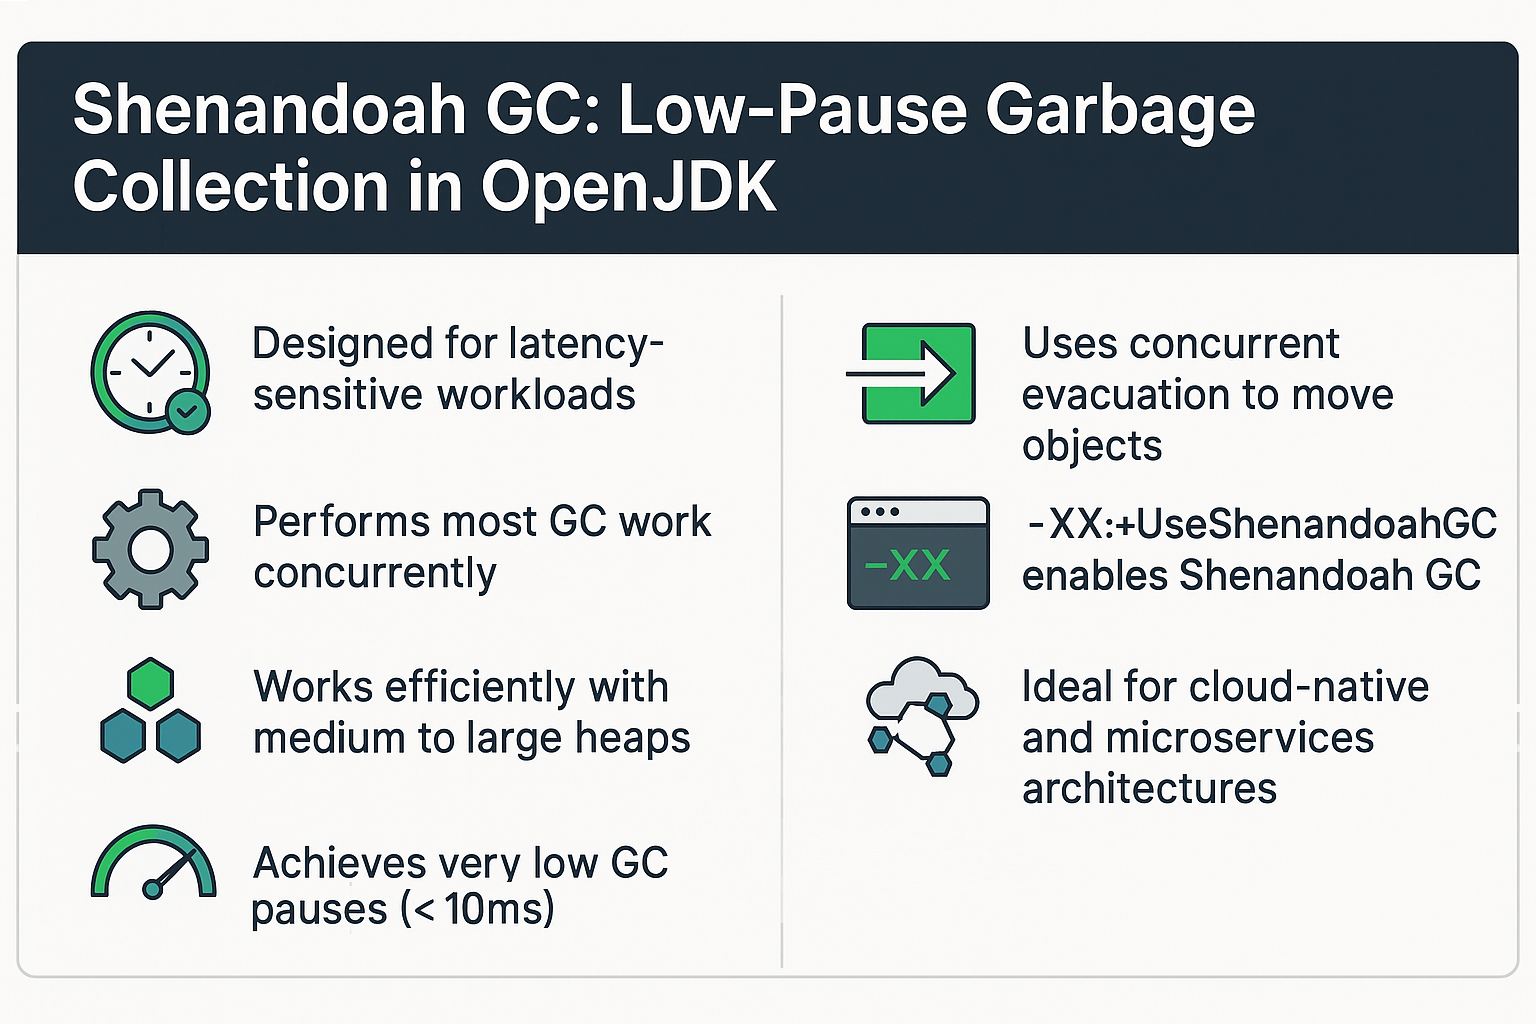
Learn Shenandoah GC in Java: a low-pause, concurrent garbage collector in OpenJDK. Explore design, tuning, advantages, and production scenarios
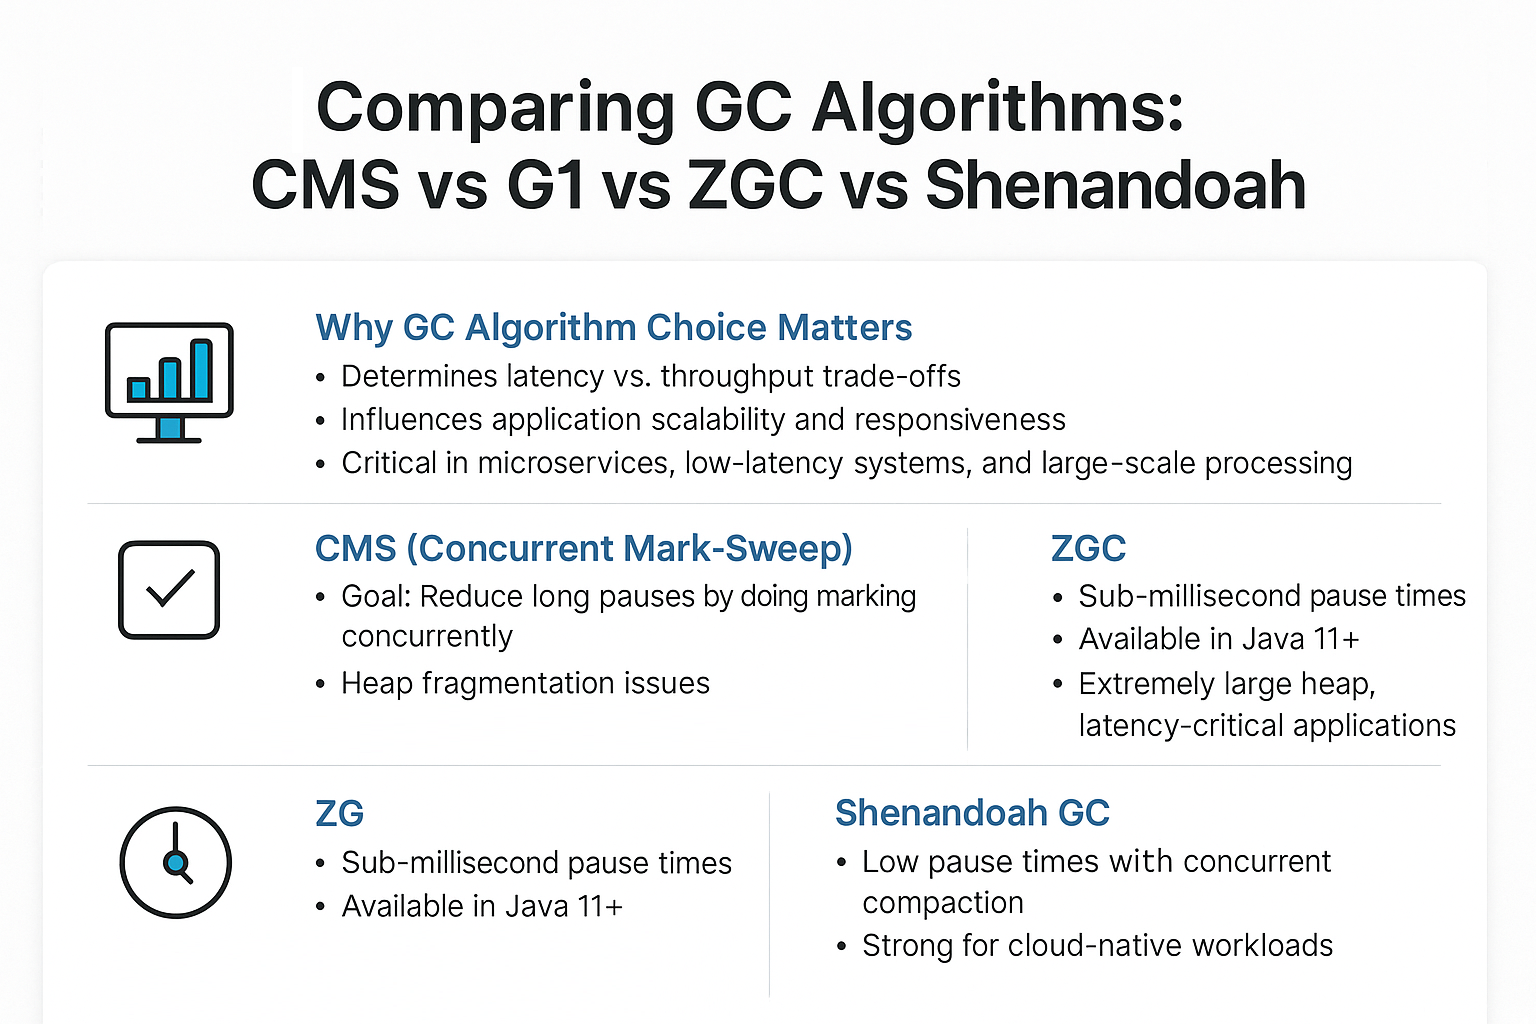
Compare CMS, G1, ZGC, and Shenandoah garbage collectors in Java. Learn differences, tuning options, and best use cases for latency and throughput
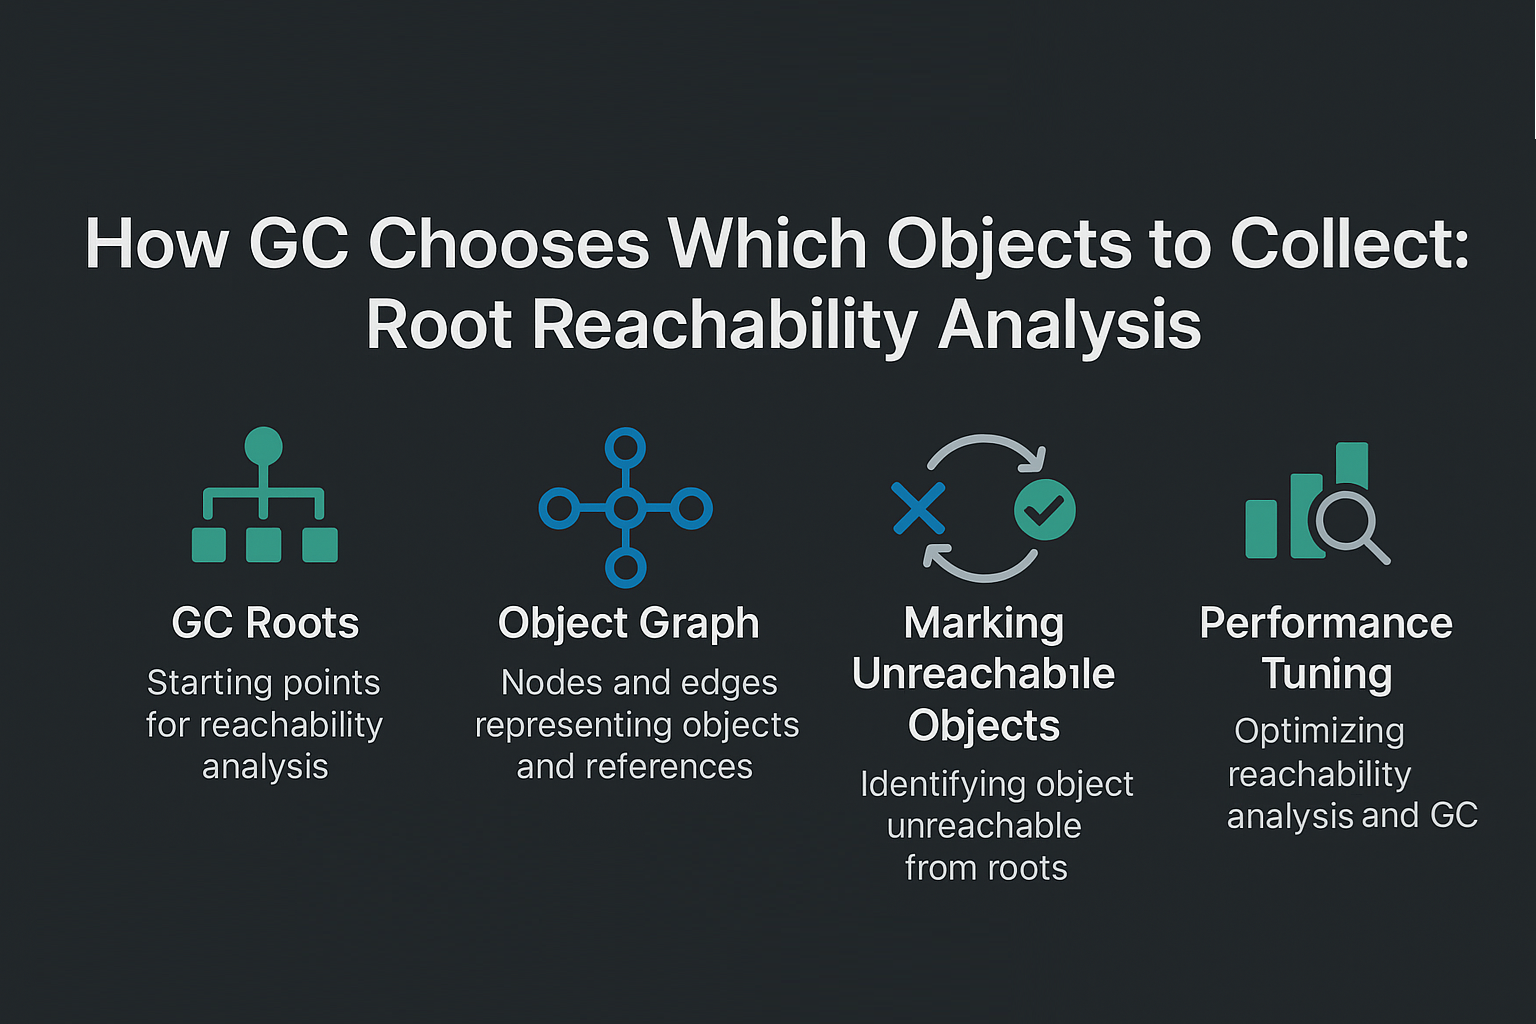
Learn how Java’s Garbage Collector identifies unreachable objects using root reachability analysis, improving memory efficiency, performance, and reliability
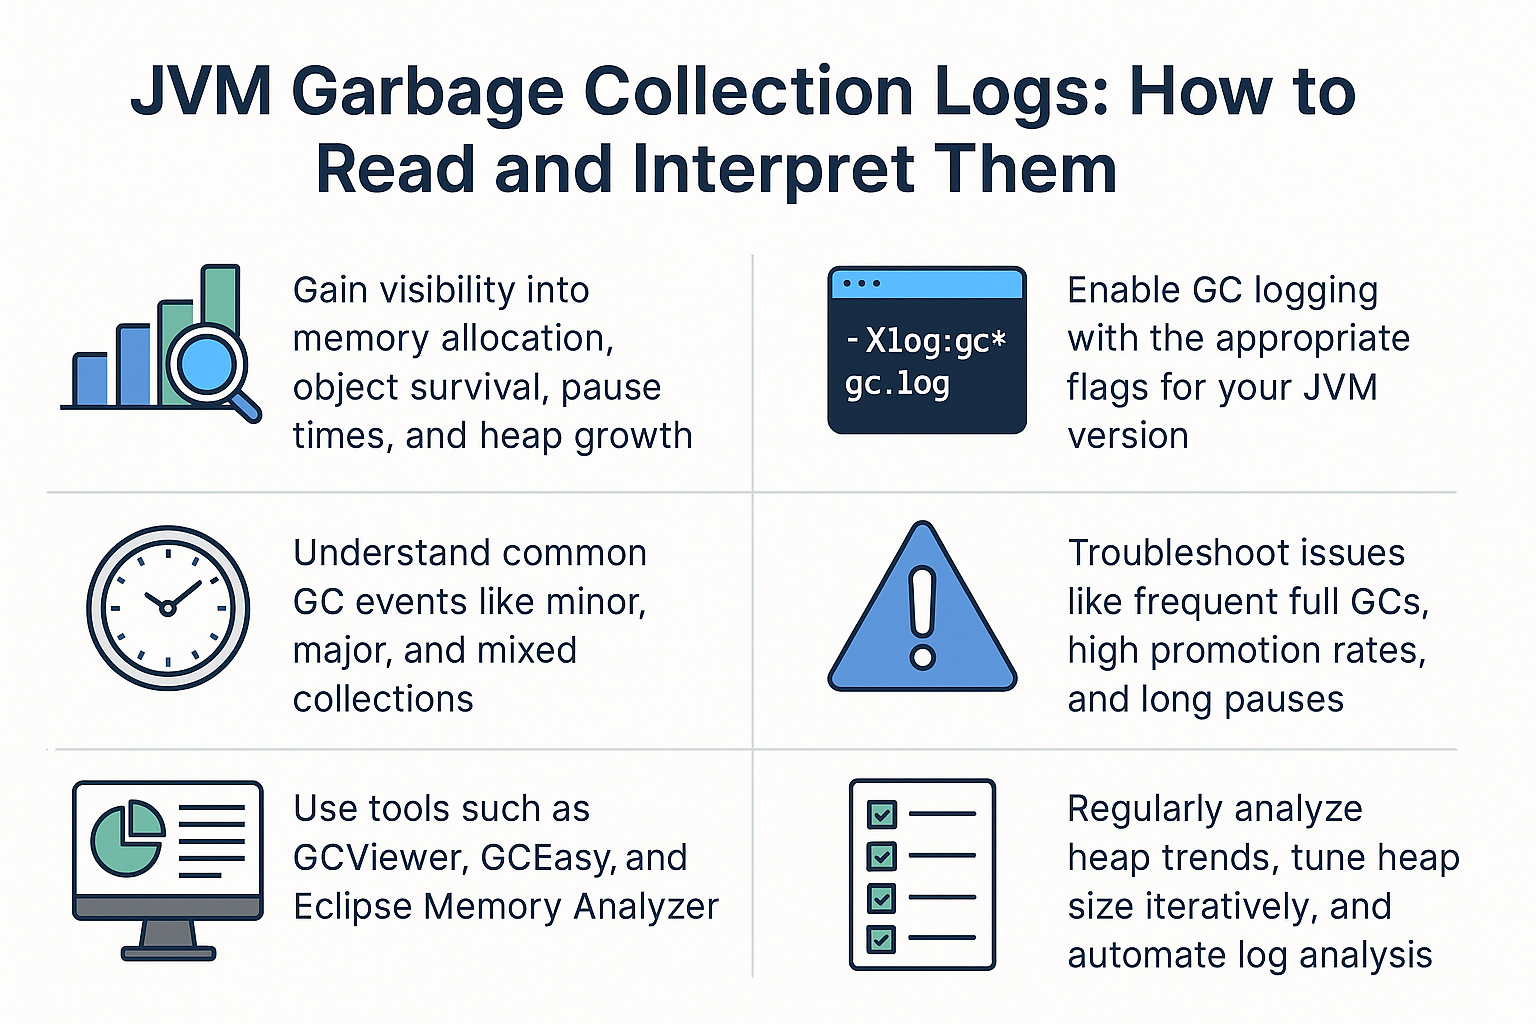
Master the art of reading and interpreting JVM Garbage Collection logs to optimize performance, reduce latency, and troubleshoot memory issues effectively
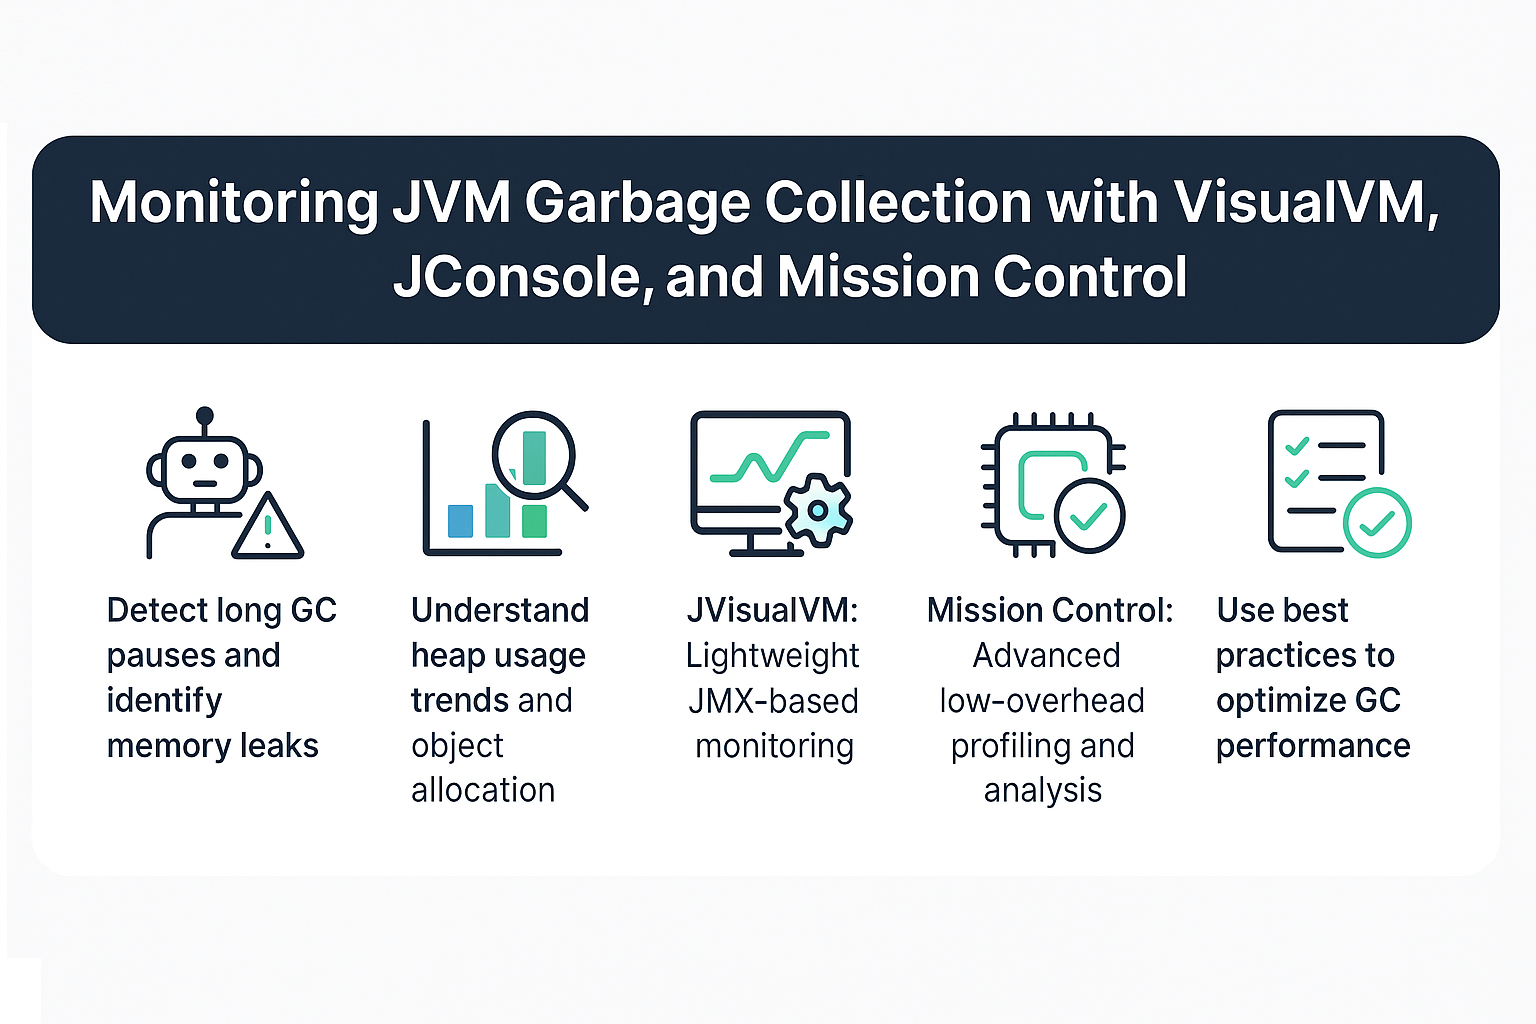
Learn how to monitor and analyze JVM Garbage Collection using JVisualVM, JConsole, and Mission Control for tuning, troubleshooting, and optimizing Java apps
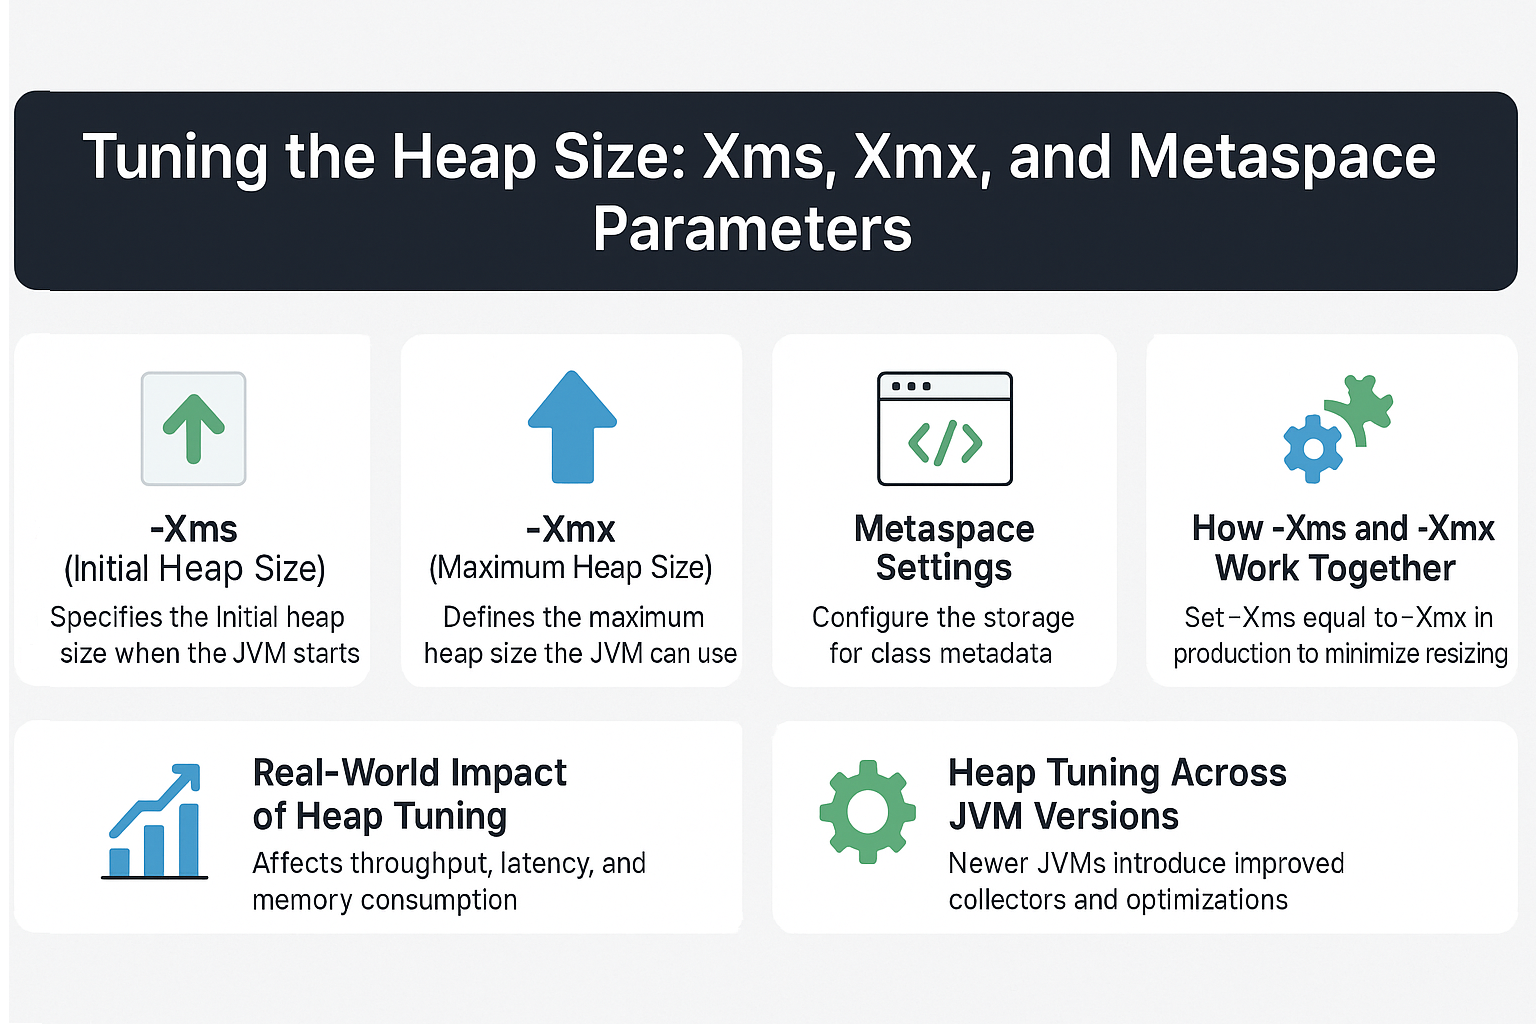
Learn how to tune JVM heap size with Xms, Xmx, and Metaspace parameters to improve performance, prevent memory errors, and optimize garbage collection
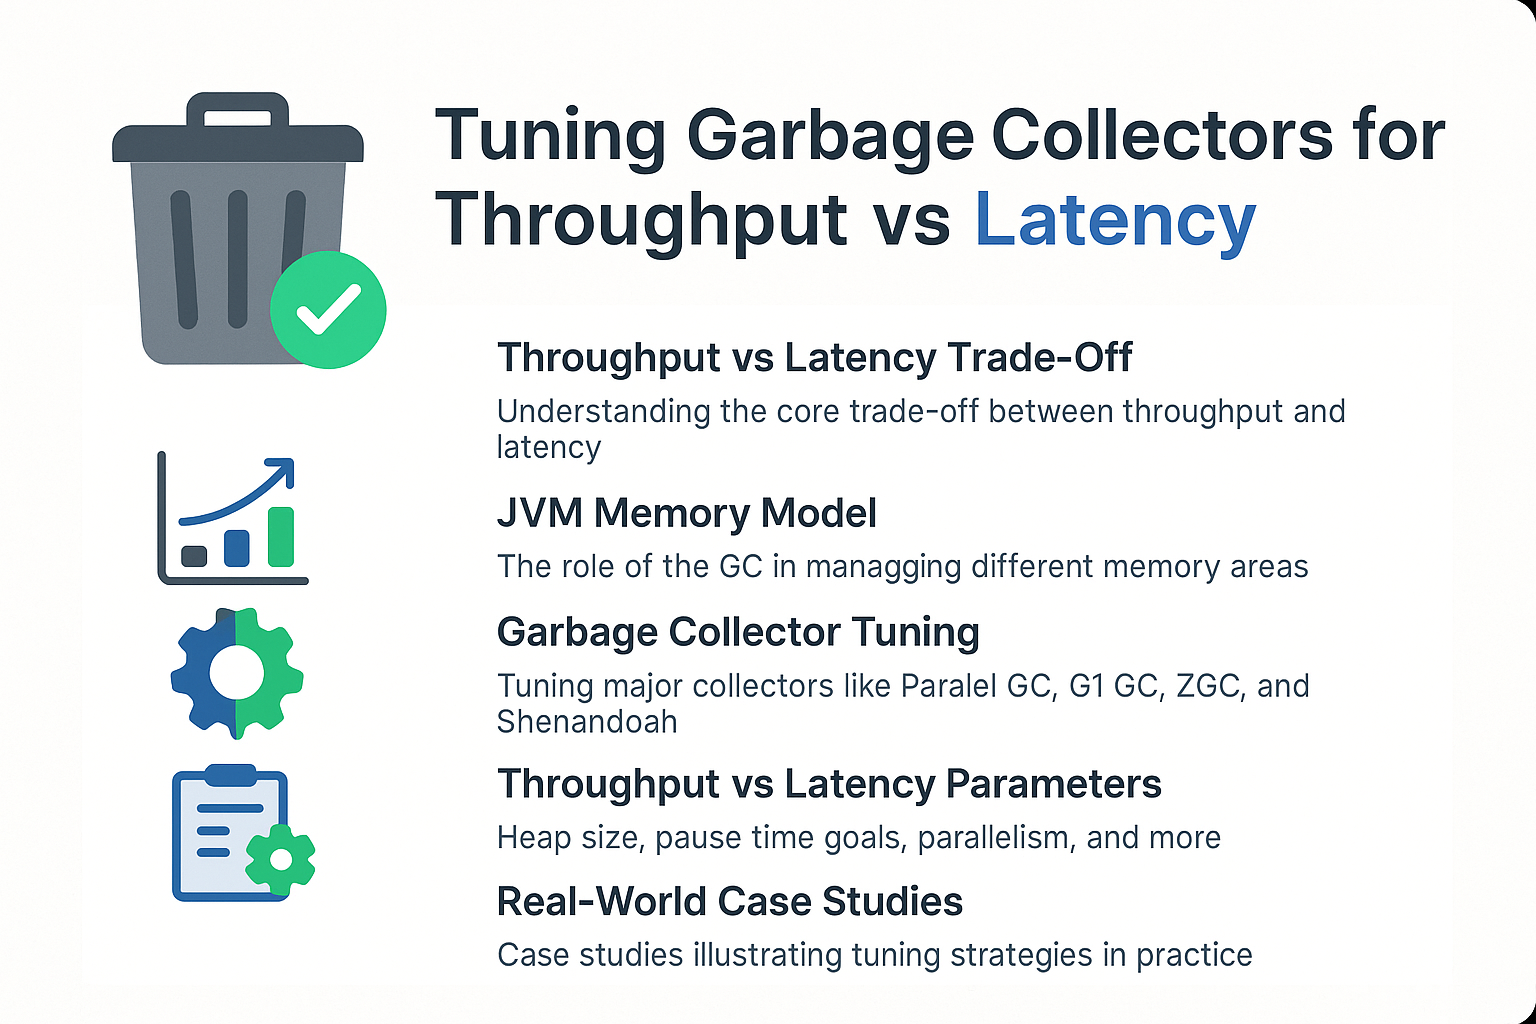
Learn how to tune JVM Garbage Collectors for throughput vs latency trade-offs, with best practices, GC flags, case studies, and real-world tuning strategies
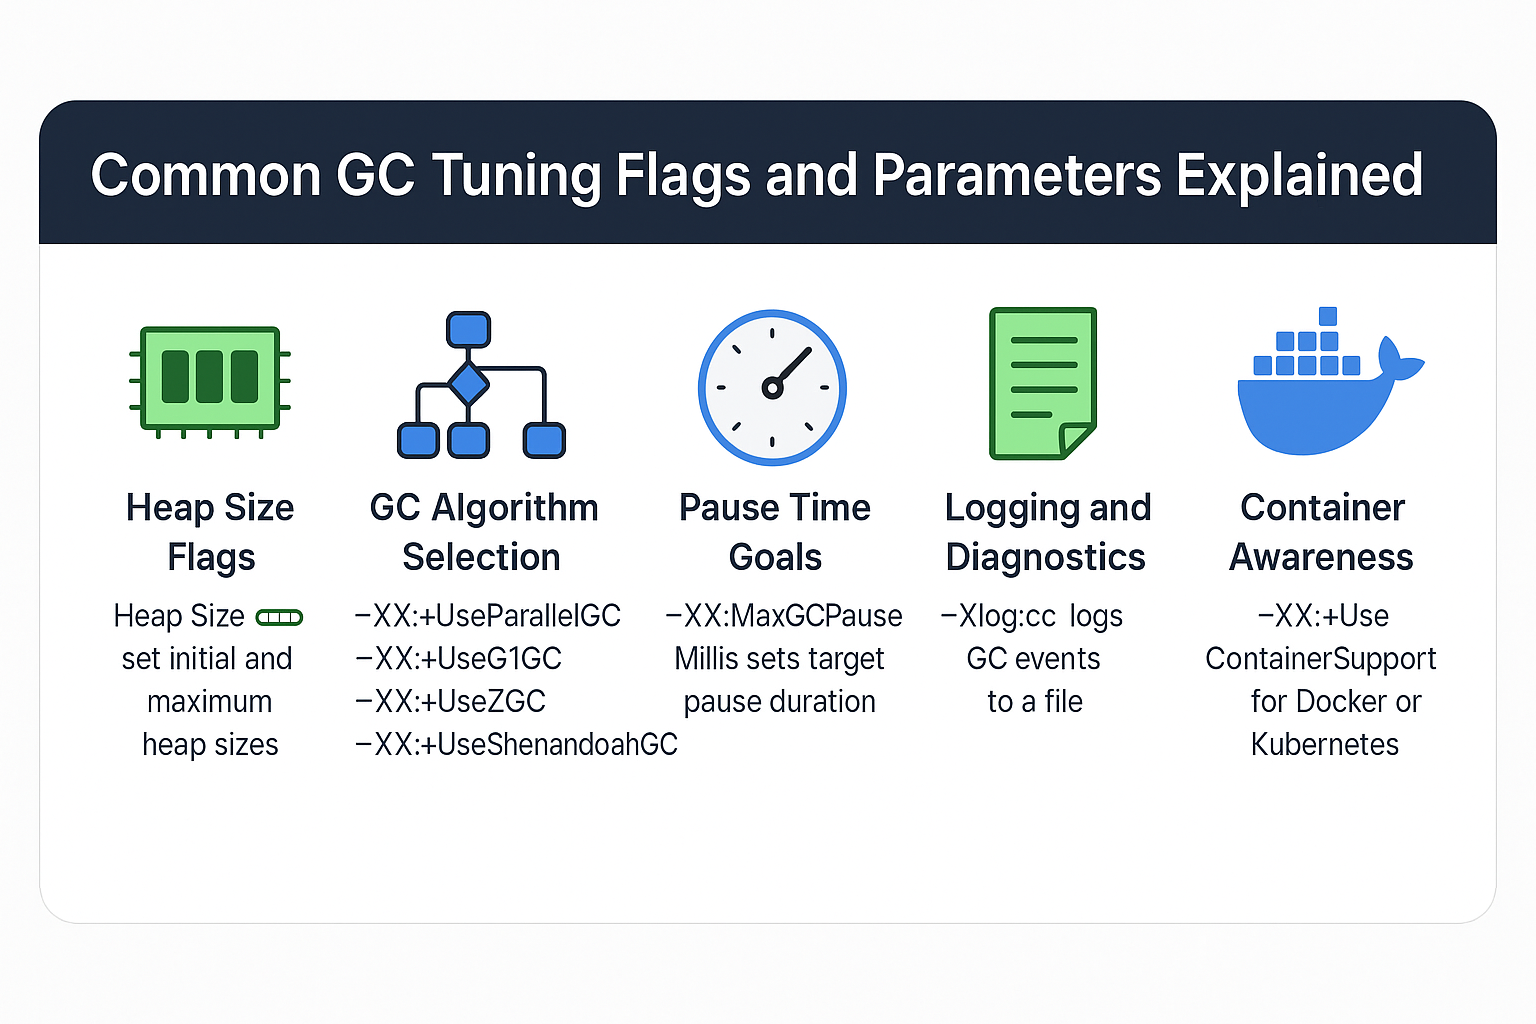
Learn the most important JVM garbage collection tuning flags and parameters, their impact on performance, and how to use them effectively in production
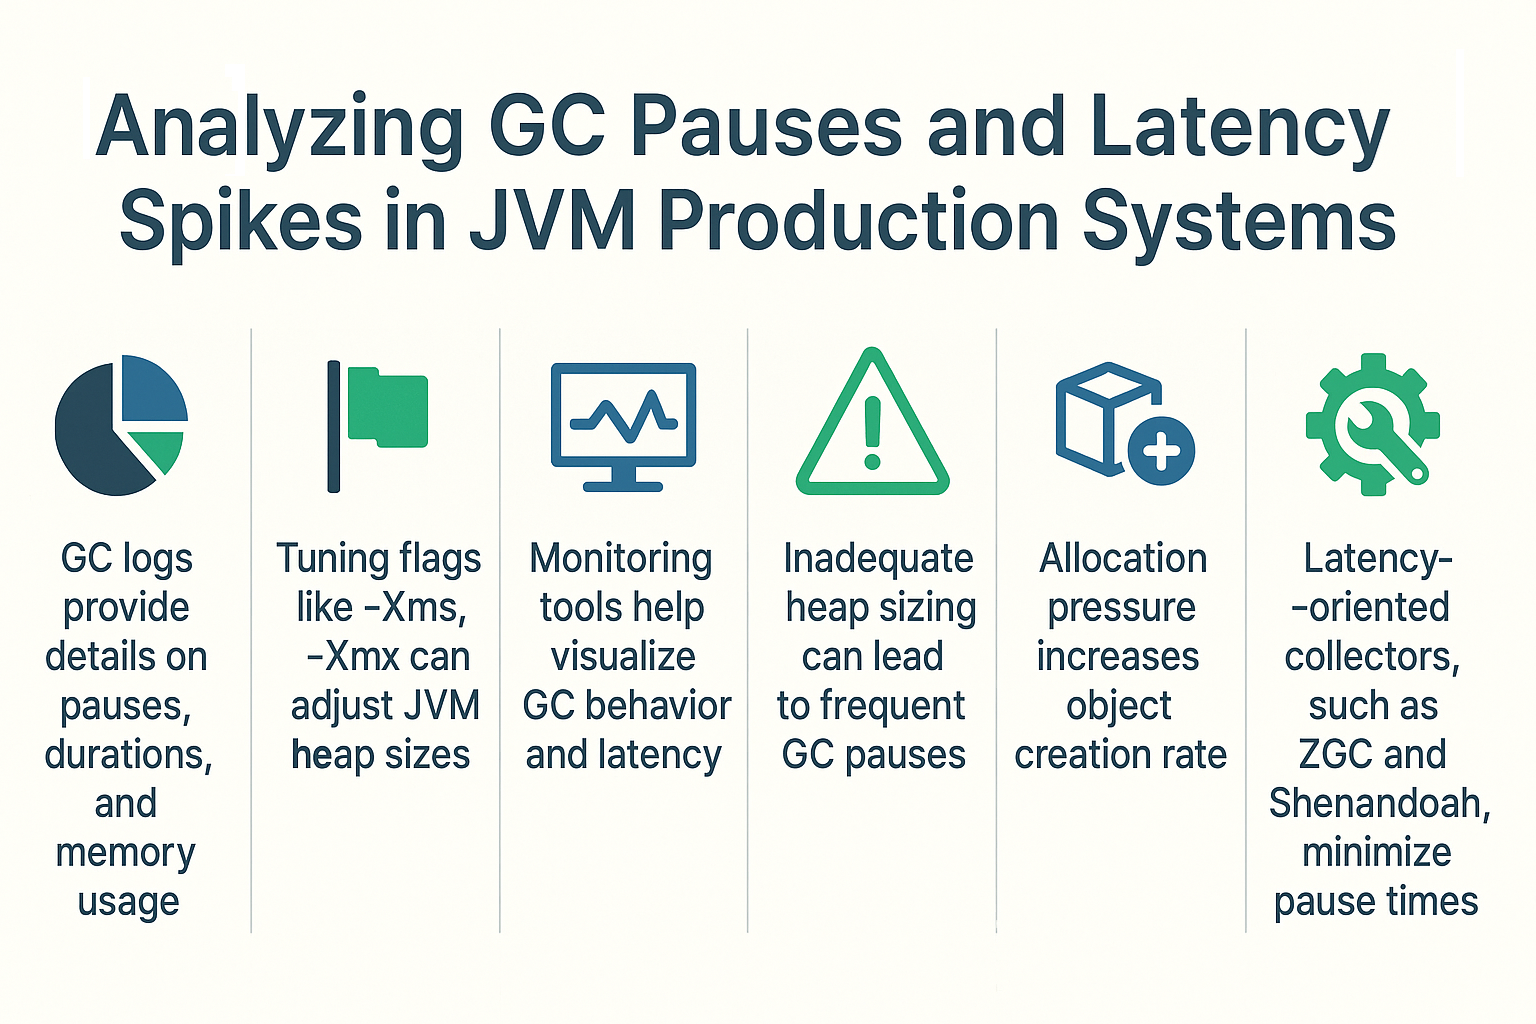
Learn how to analyze JVM garbage collection pauses and latency spikes in production using GC logs, tuning flags, and monitoring tools for stable performance
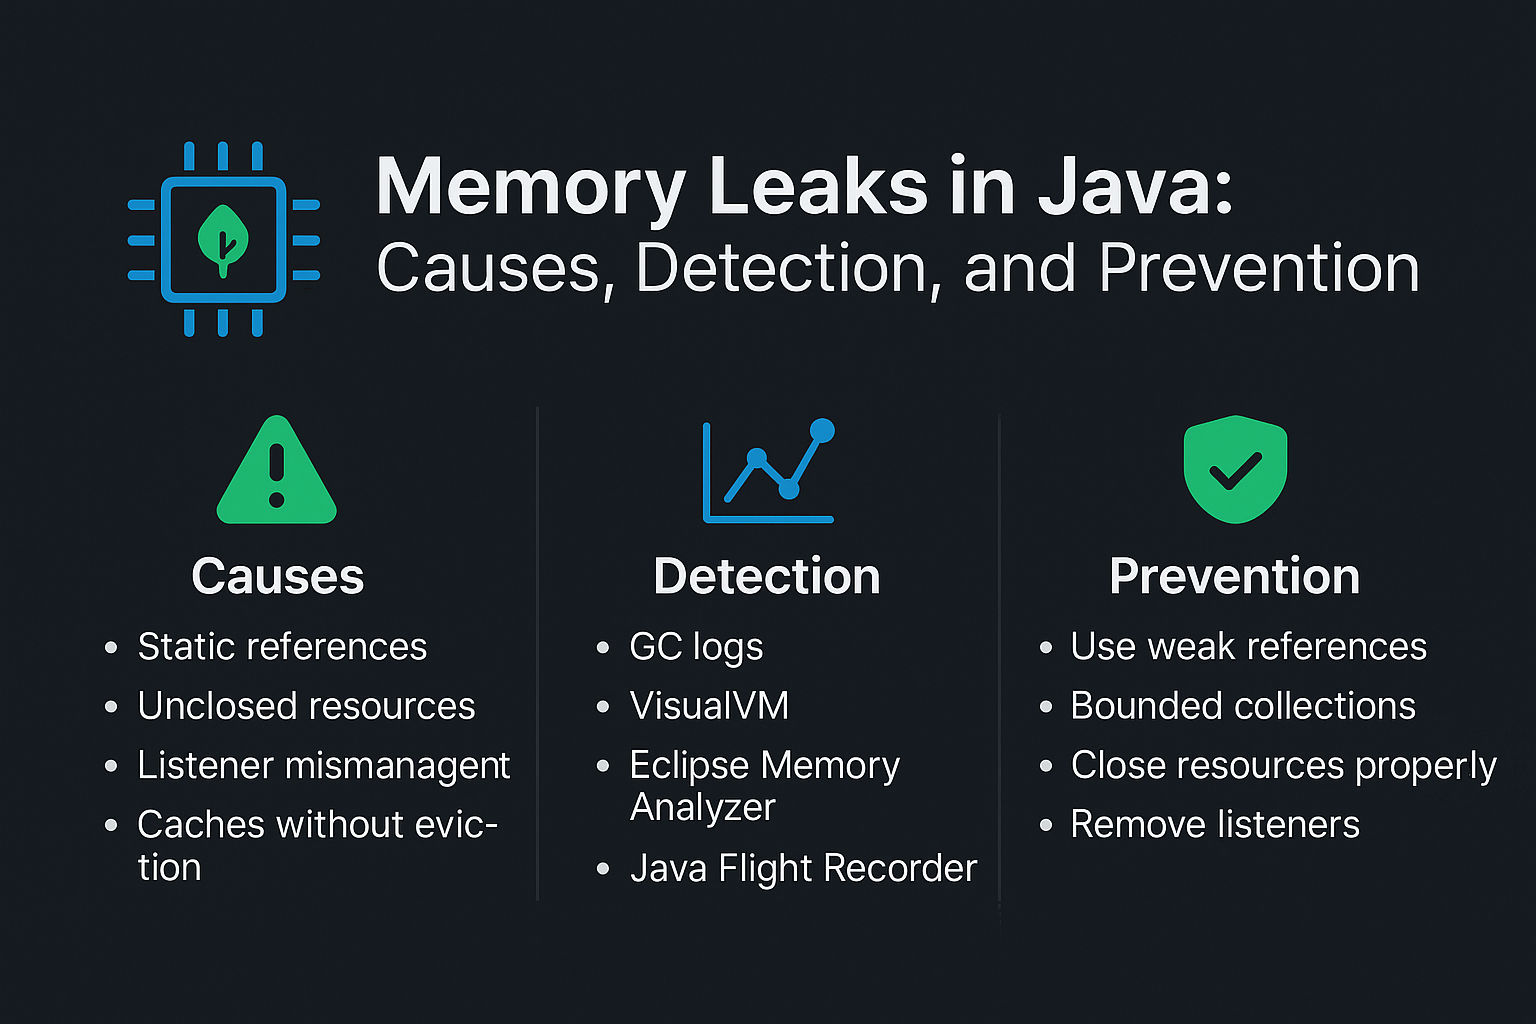
Learn what causes memory leaks in Java, how to detect them using tools like VisualVM and JFR, and best practices to prevent memory issues in production systems
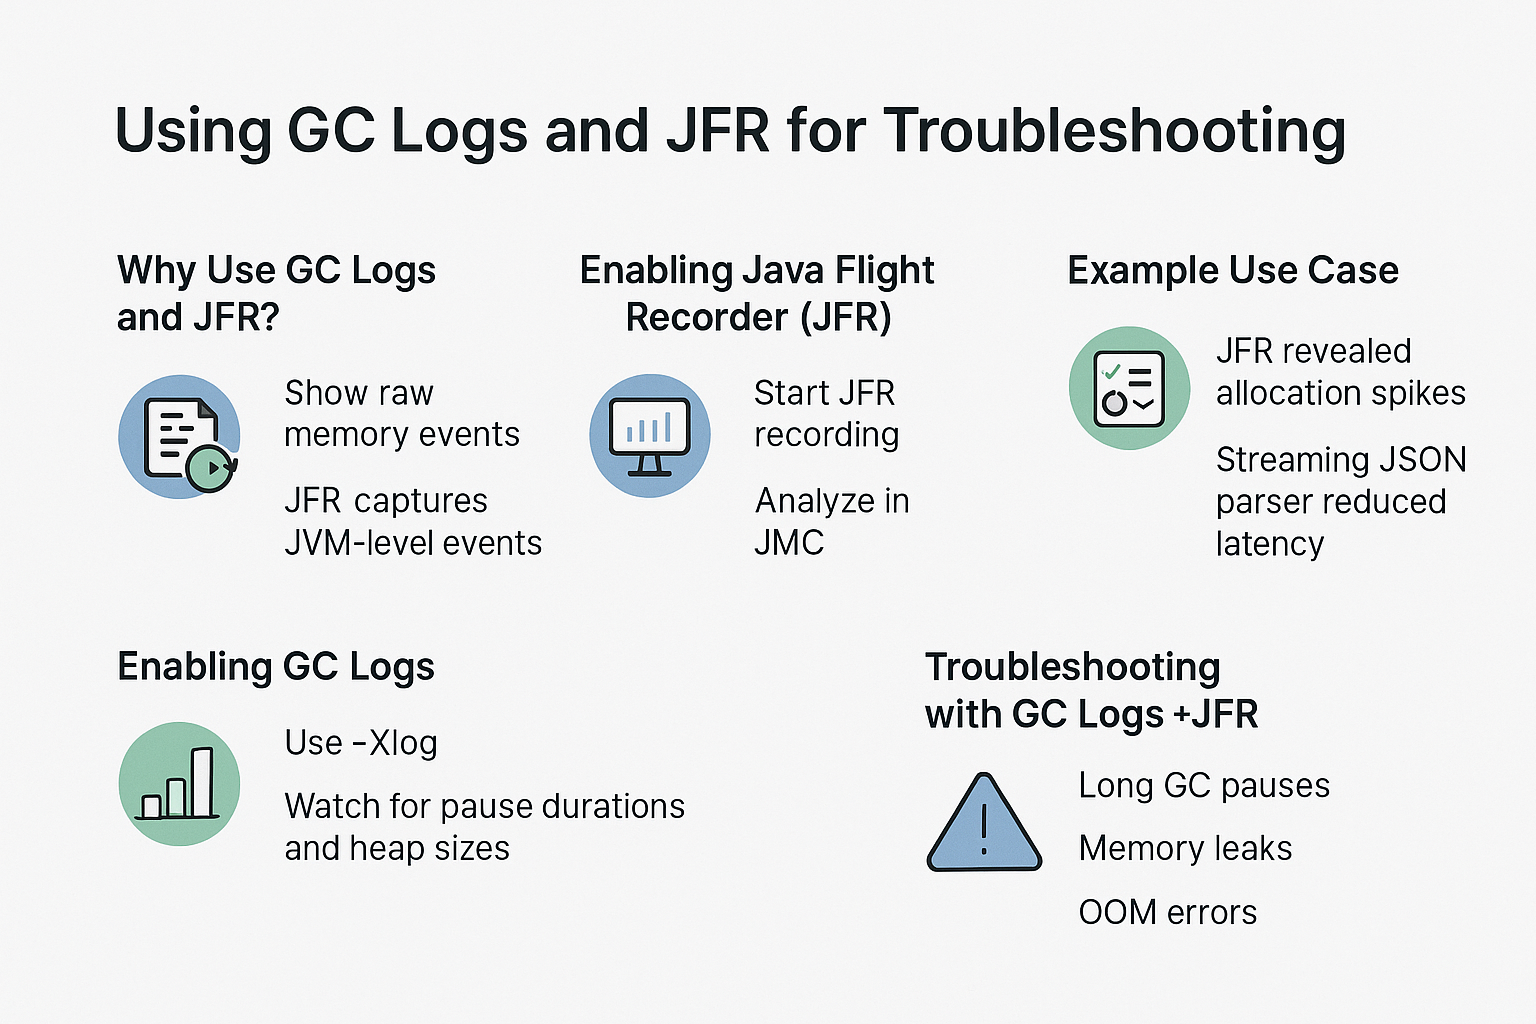
Learn how to troubleshoot JVM performance issues using GC logs and Java Flight Recorder (JFR) with real-world analysis, tuning techniques, and case studies.
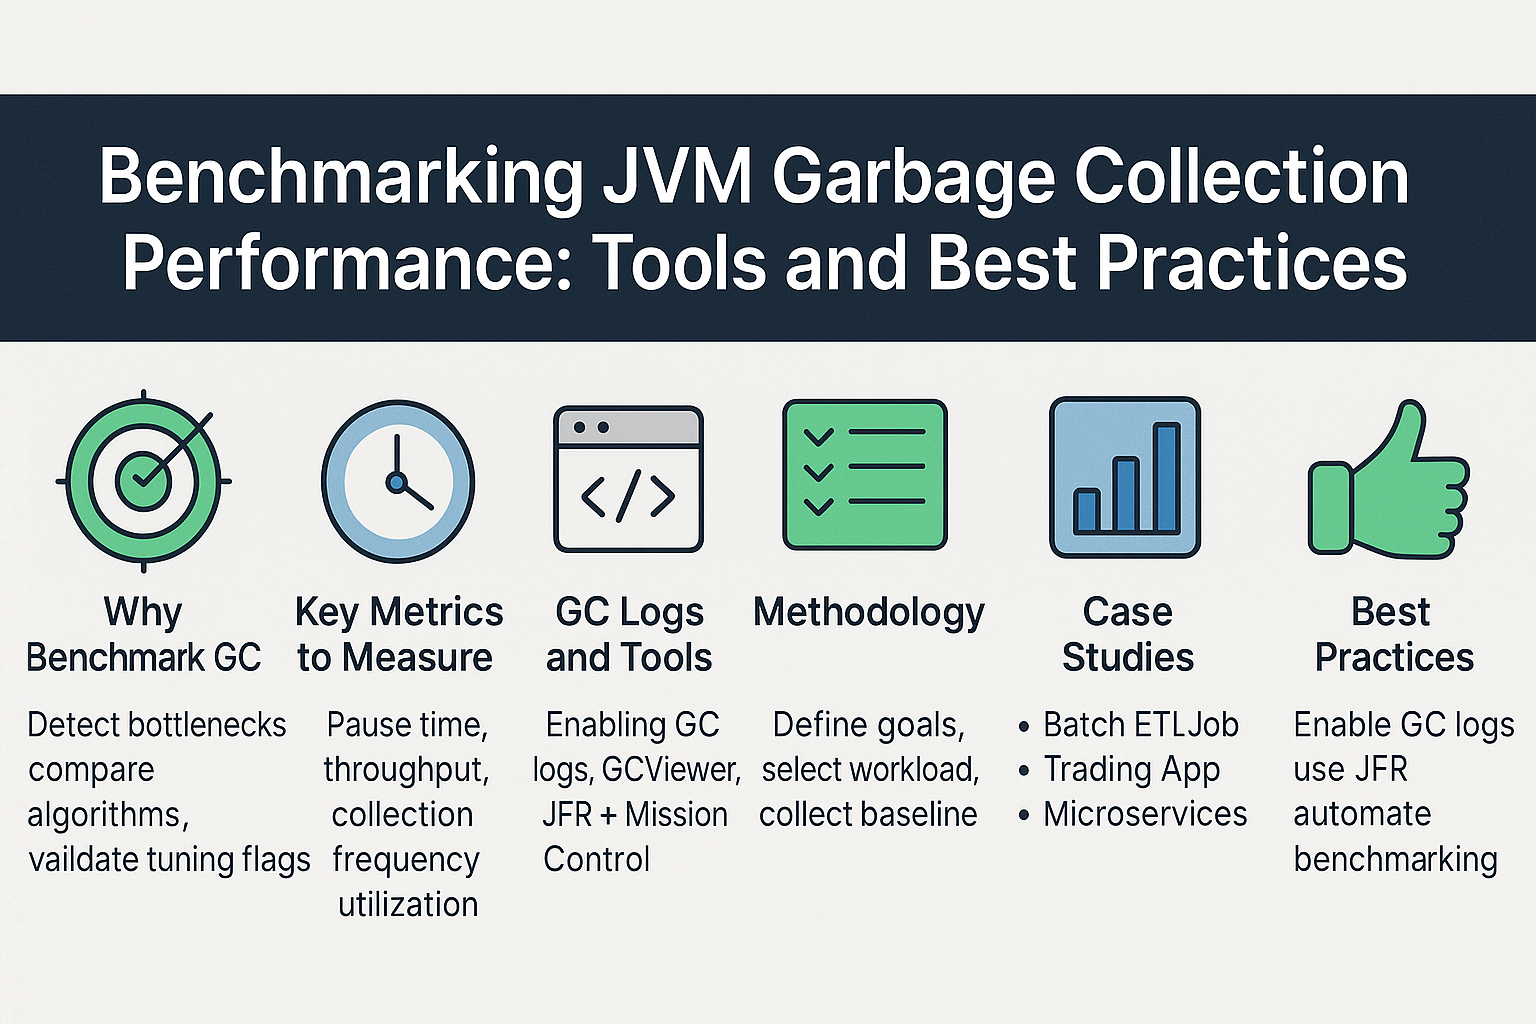
Learn how to benchmark JVM Garbage Collection performance using tools like JMH, JFR, and GC logs, plus best practices for tuning throughput and latency
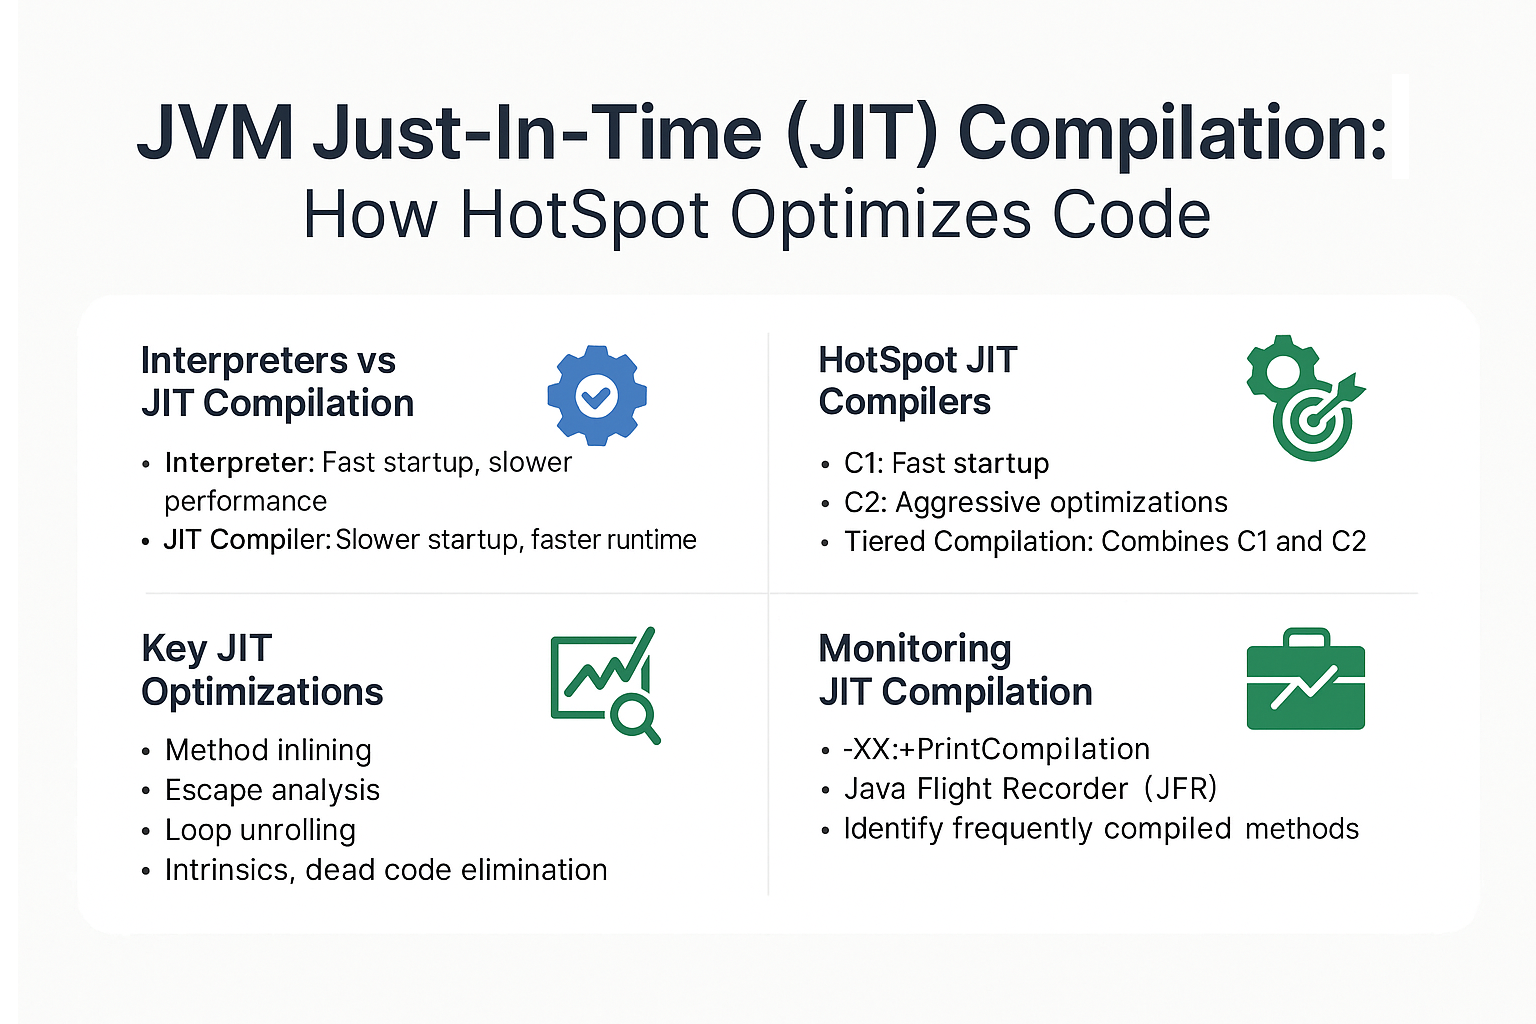
Discover how JVM Just-In-Time (JIT) compilation in HotSpot optimizes Java code with adaptive optimization, profiling, and real-world performance benefits
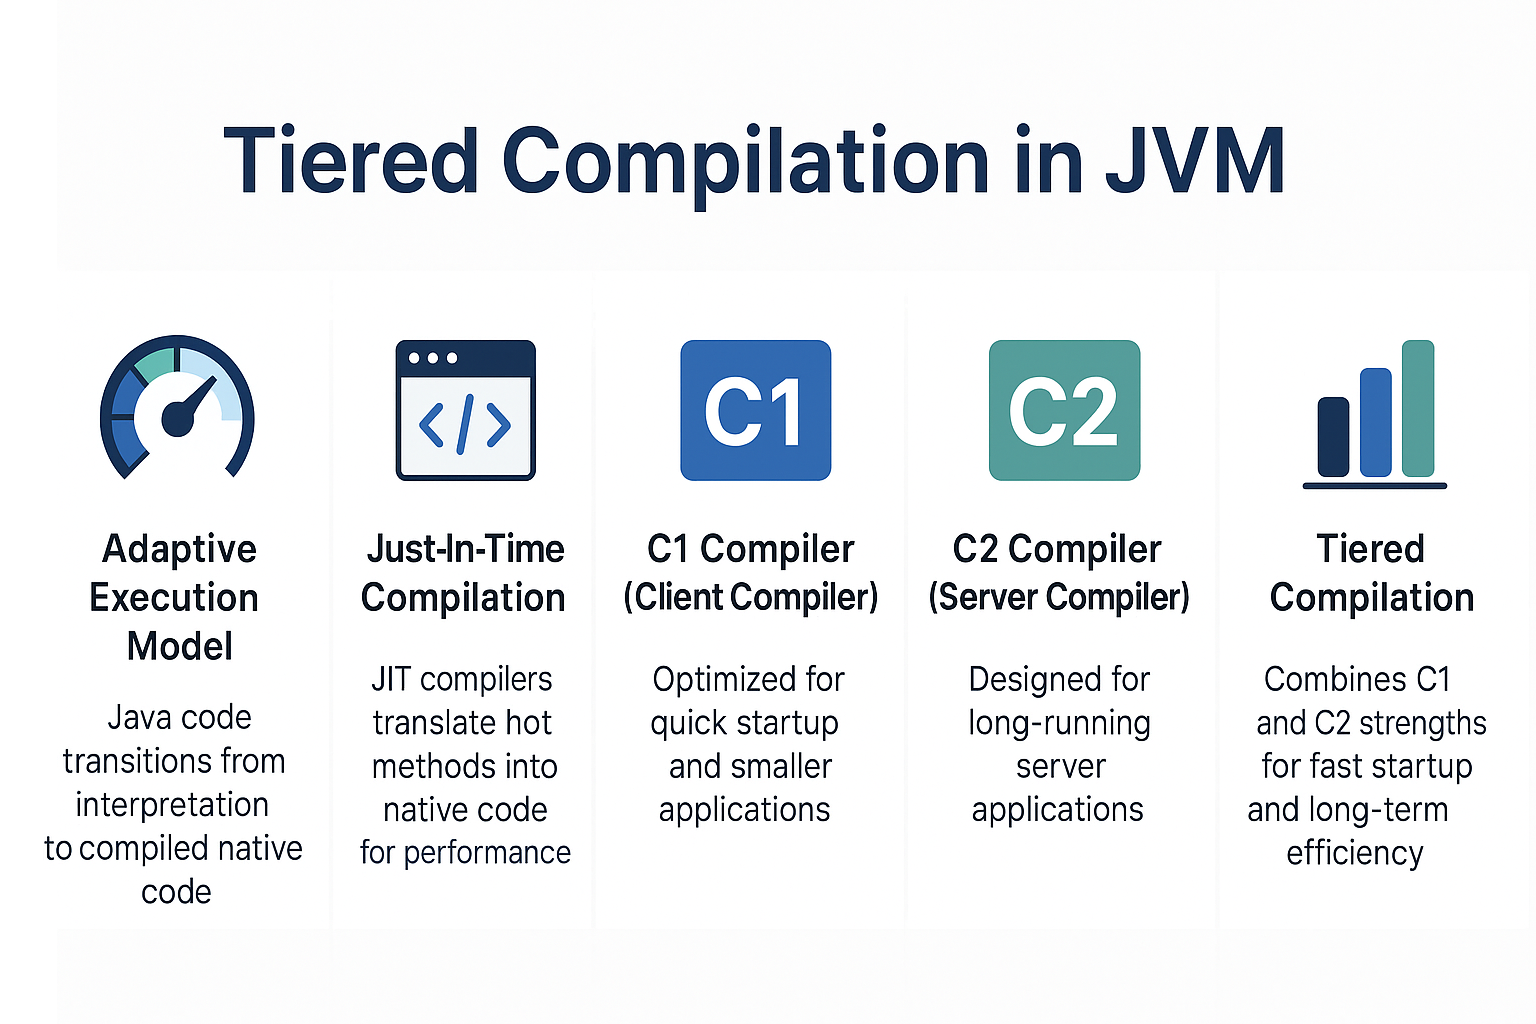
Learn how tiered compilation in JVM combines C1 and C2 compilers to balance startup performance and runtime optimization for Java applications
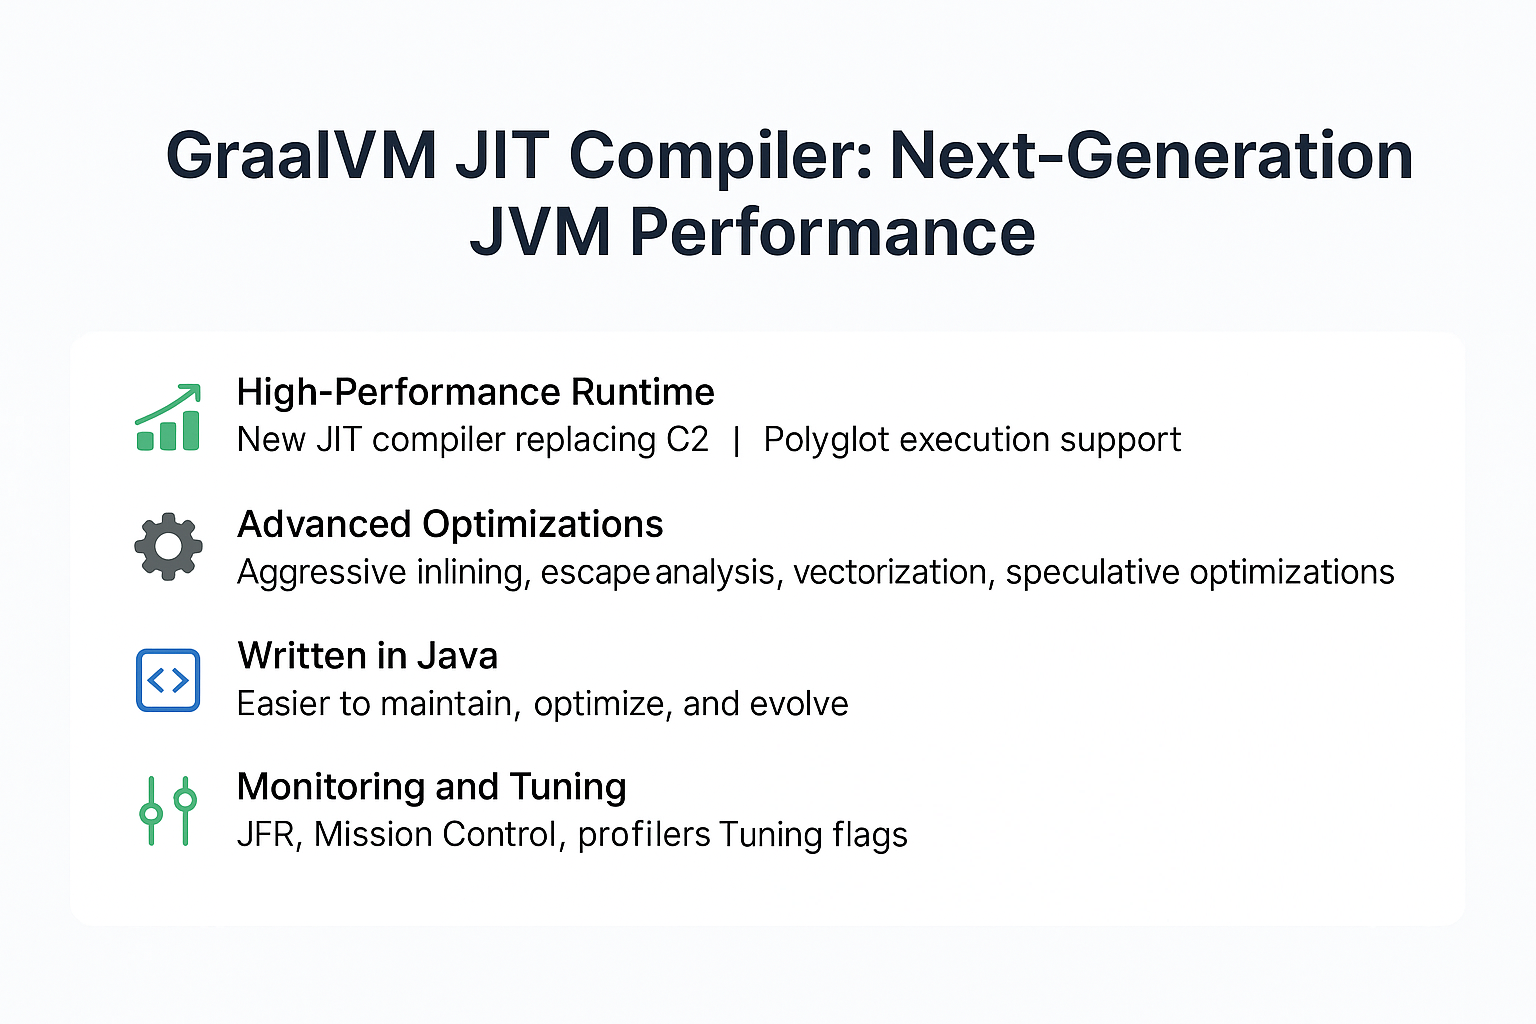
Explore GraalVM’s JIT compiler for next-generation JVM performance, advanced optimizations, polyglot support, and real-world tuning strategies for Java apps.
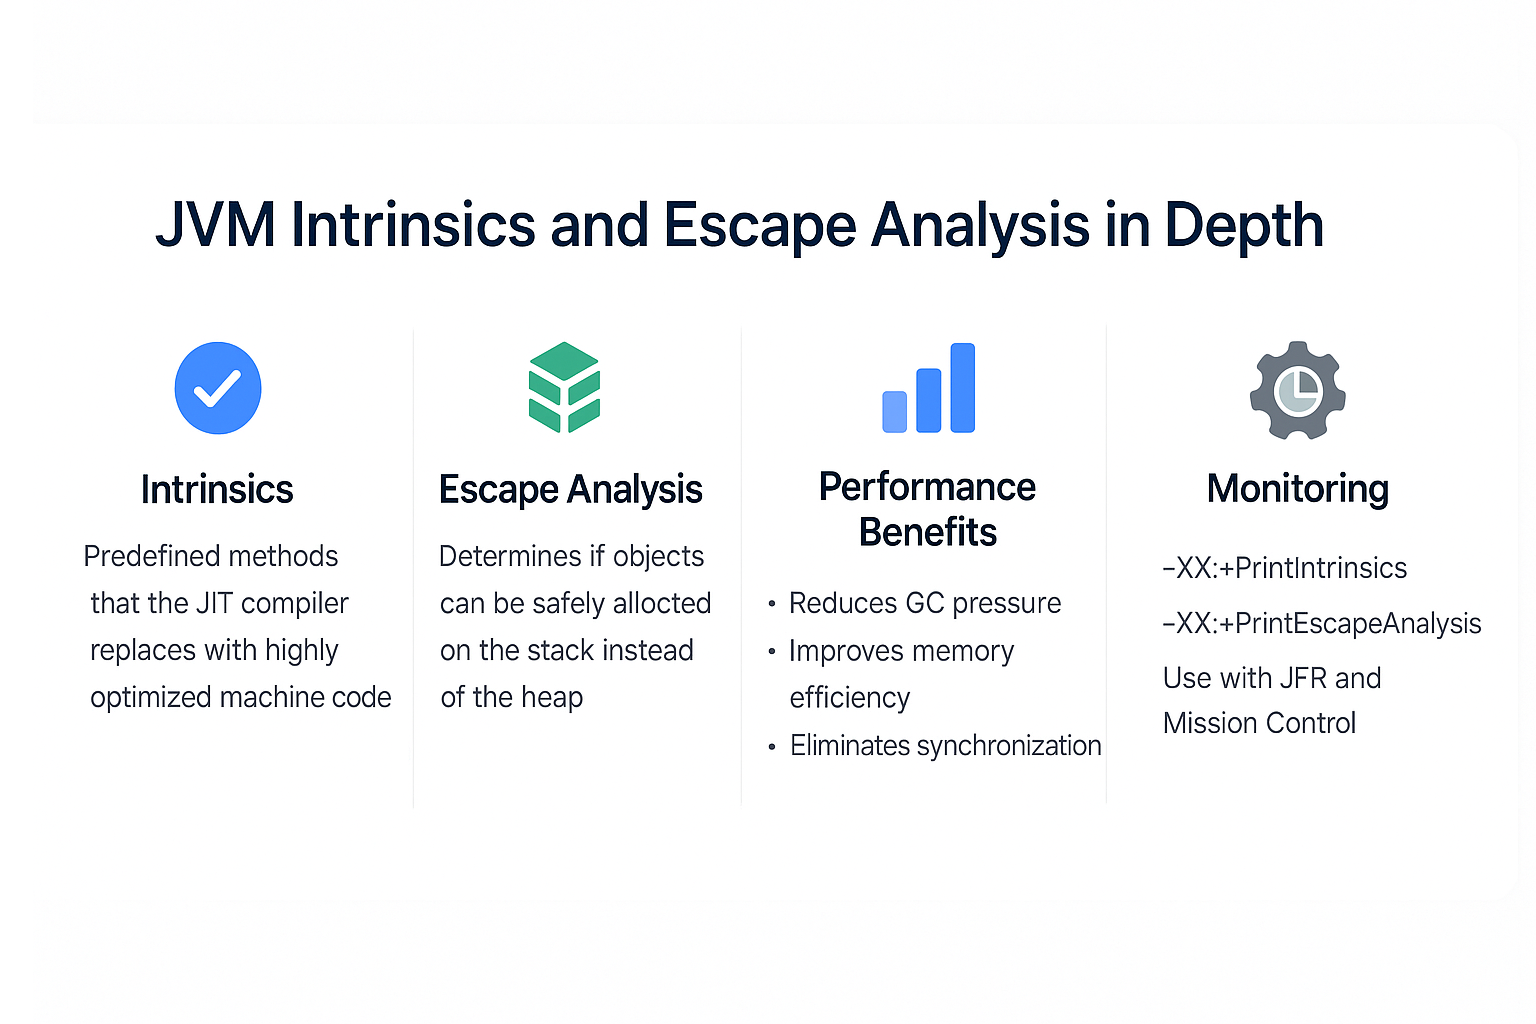
Dive deep into JVM intrinsics and escape analysis, how HotSpot JIT optimizes code, reduces GC pressure, and improves Java performance in real-world apps.
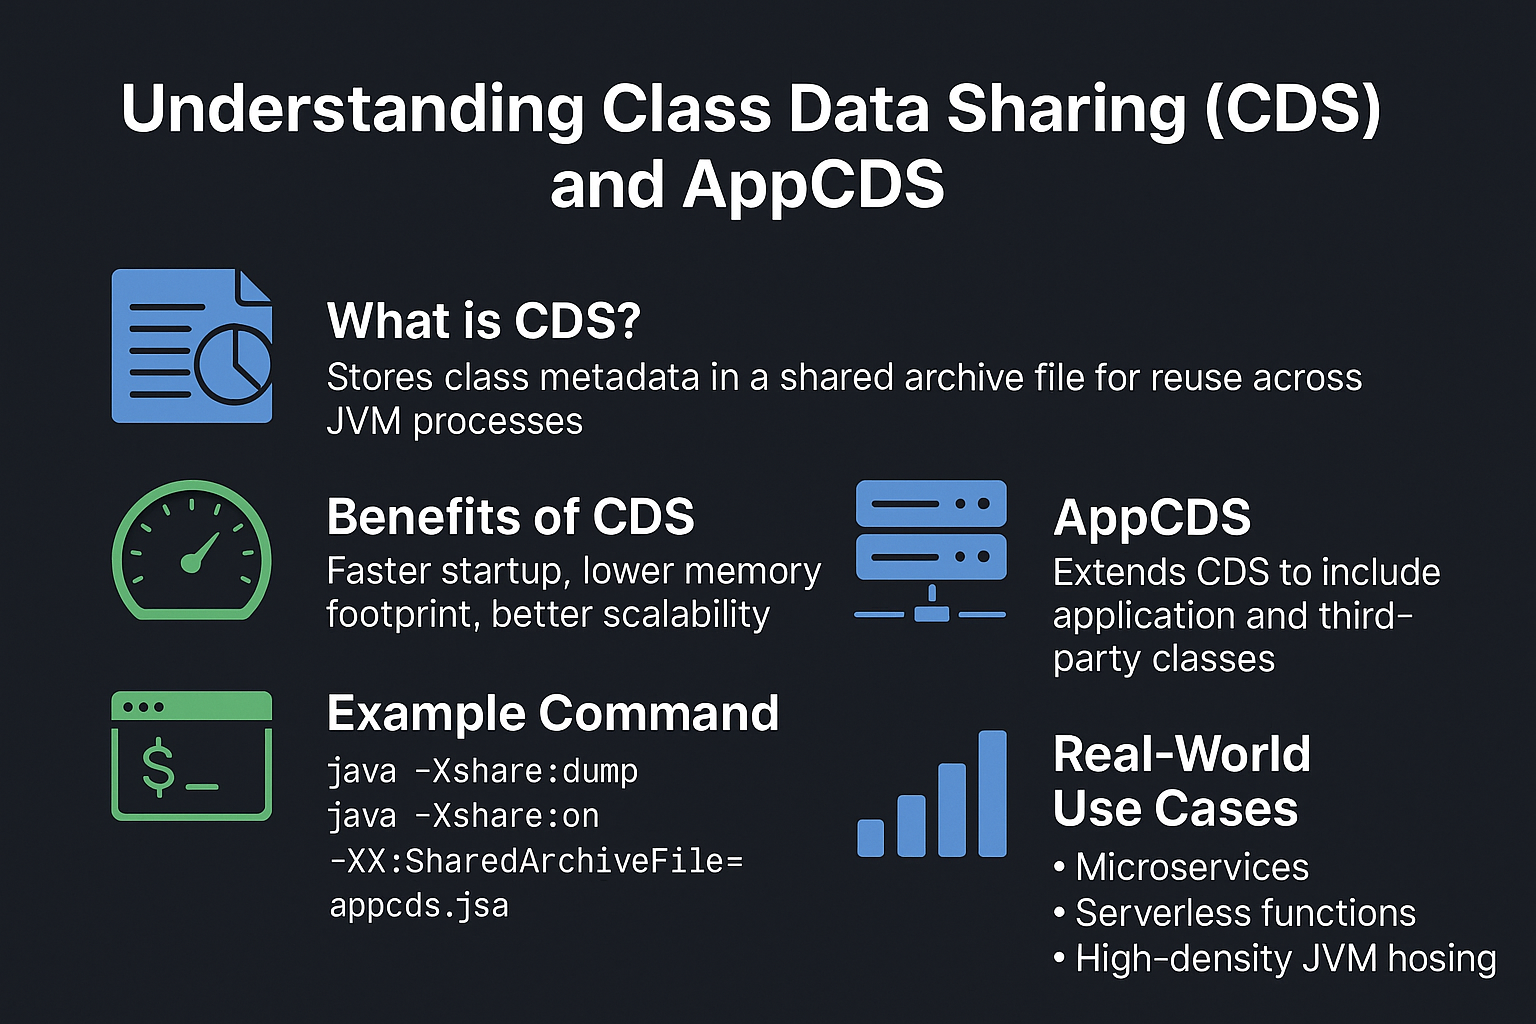
Learn how Class Data Sharing (CDS) and AppCDS optimize JVM startup, reduce memory footprint, and improve performance in Java applications with real-world use cases
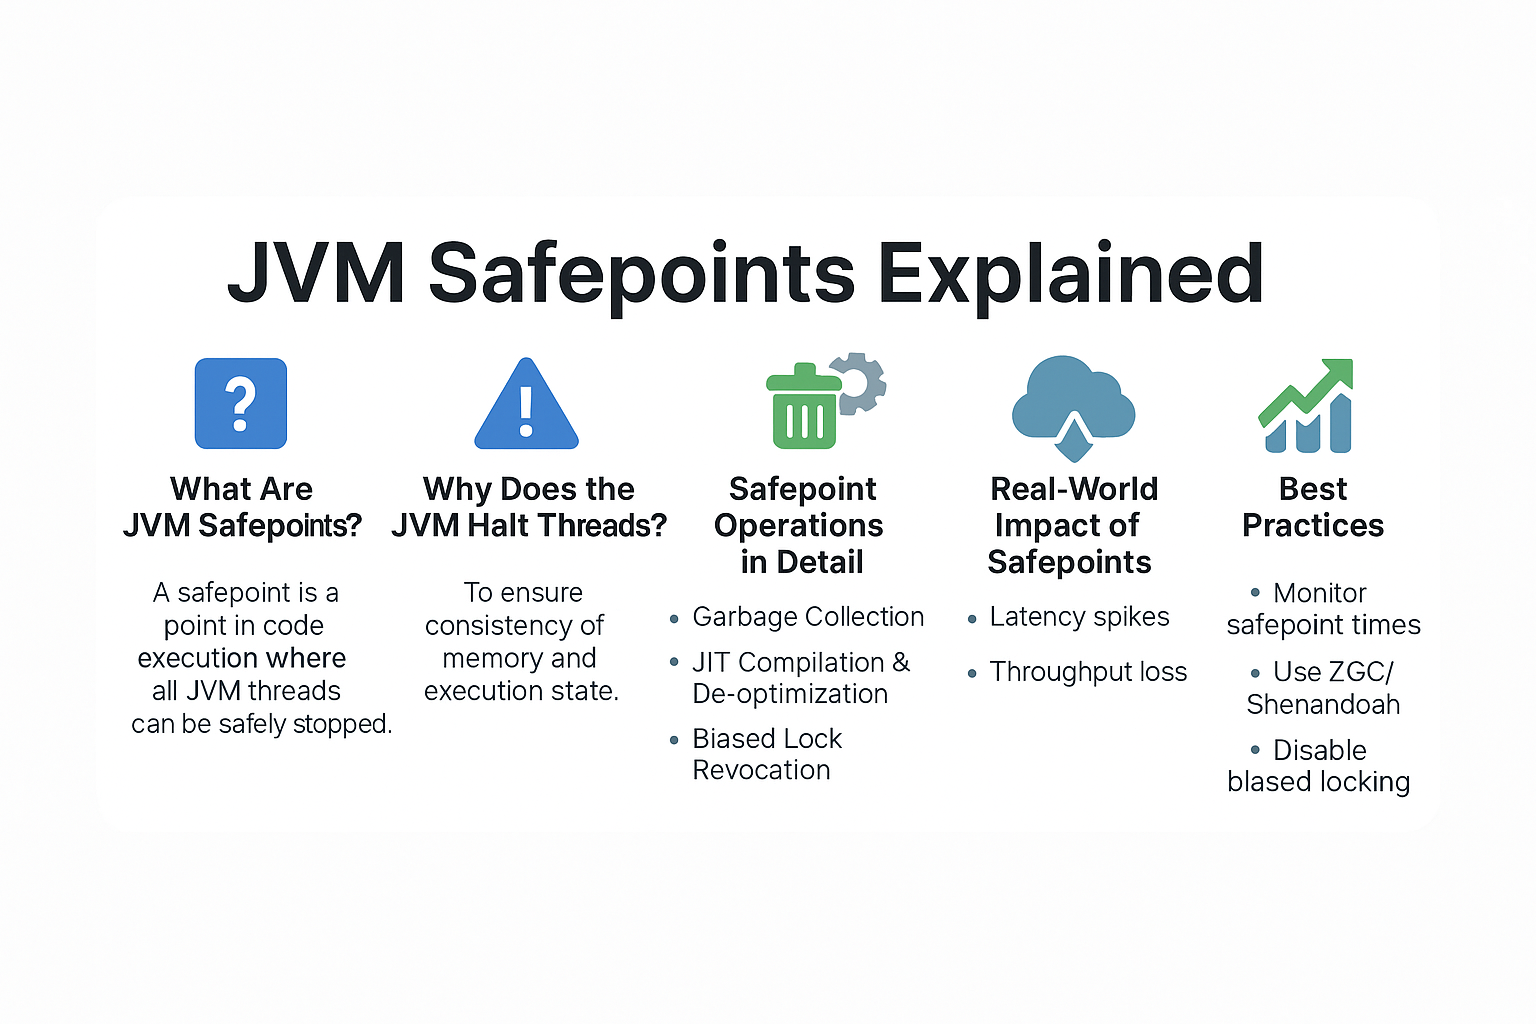
Understand JVM safepoints, why the JVM halts threads, their role in garbage collection, JIT compilation, and how to optimize safepoint behavior in production systems
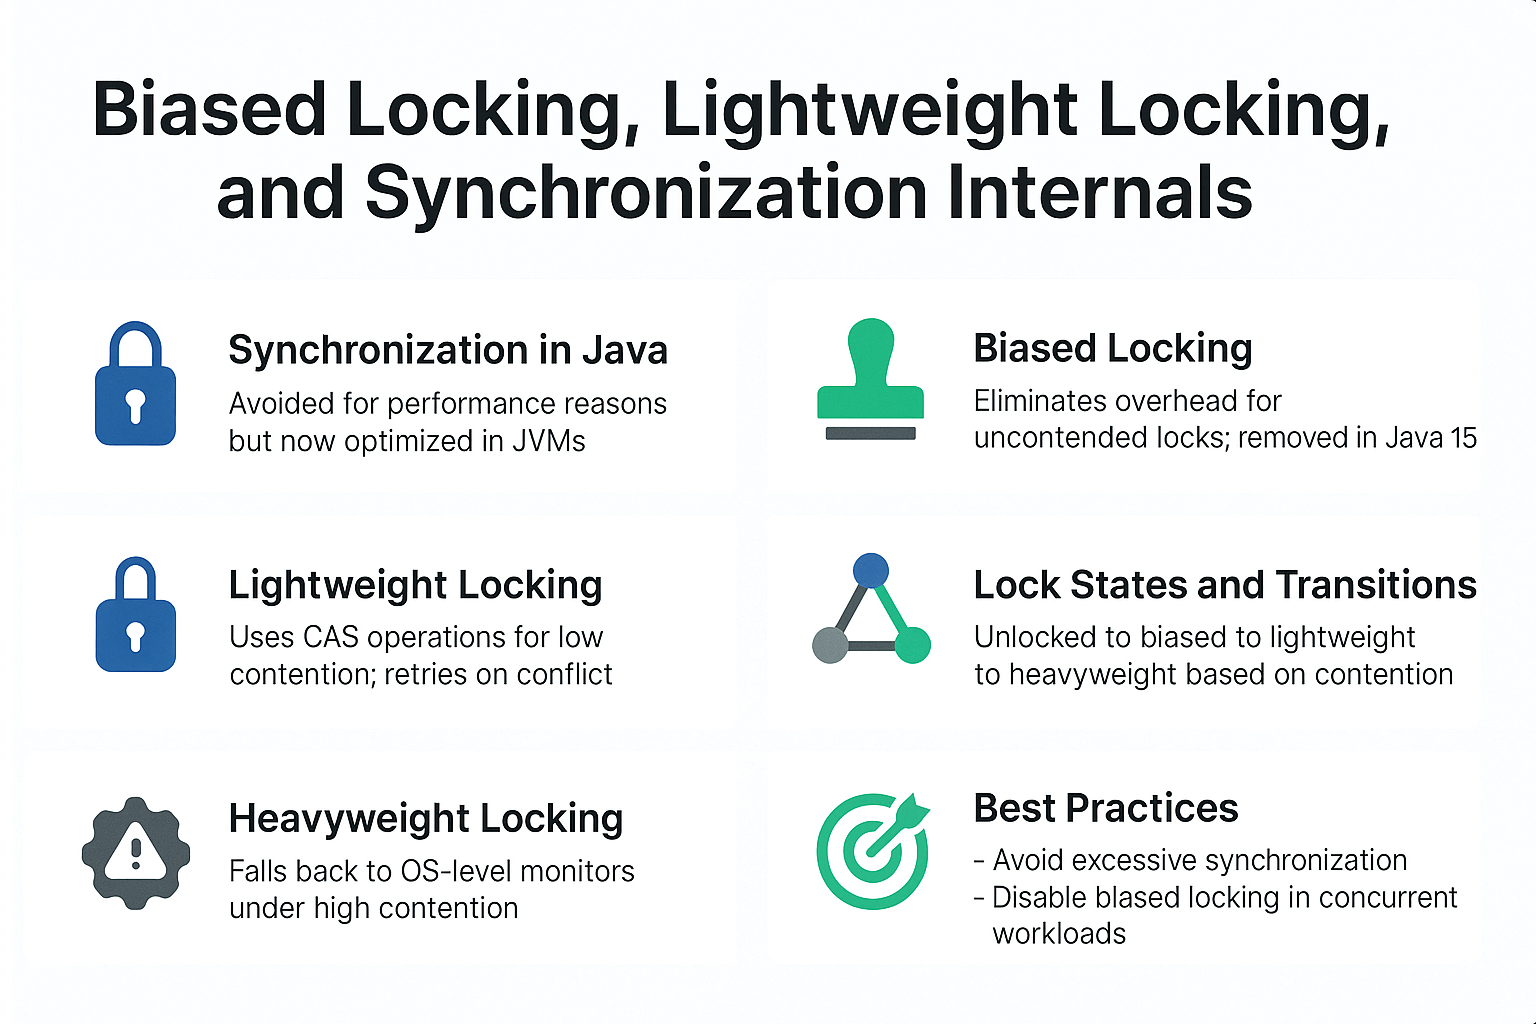
Learn JVM synchronization internals including biased locking, lightweight locking, and object monitors. Discover performance impacts and best practices in Java apps
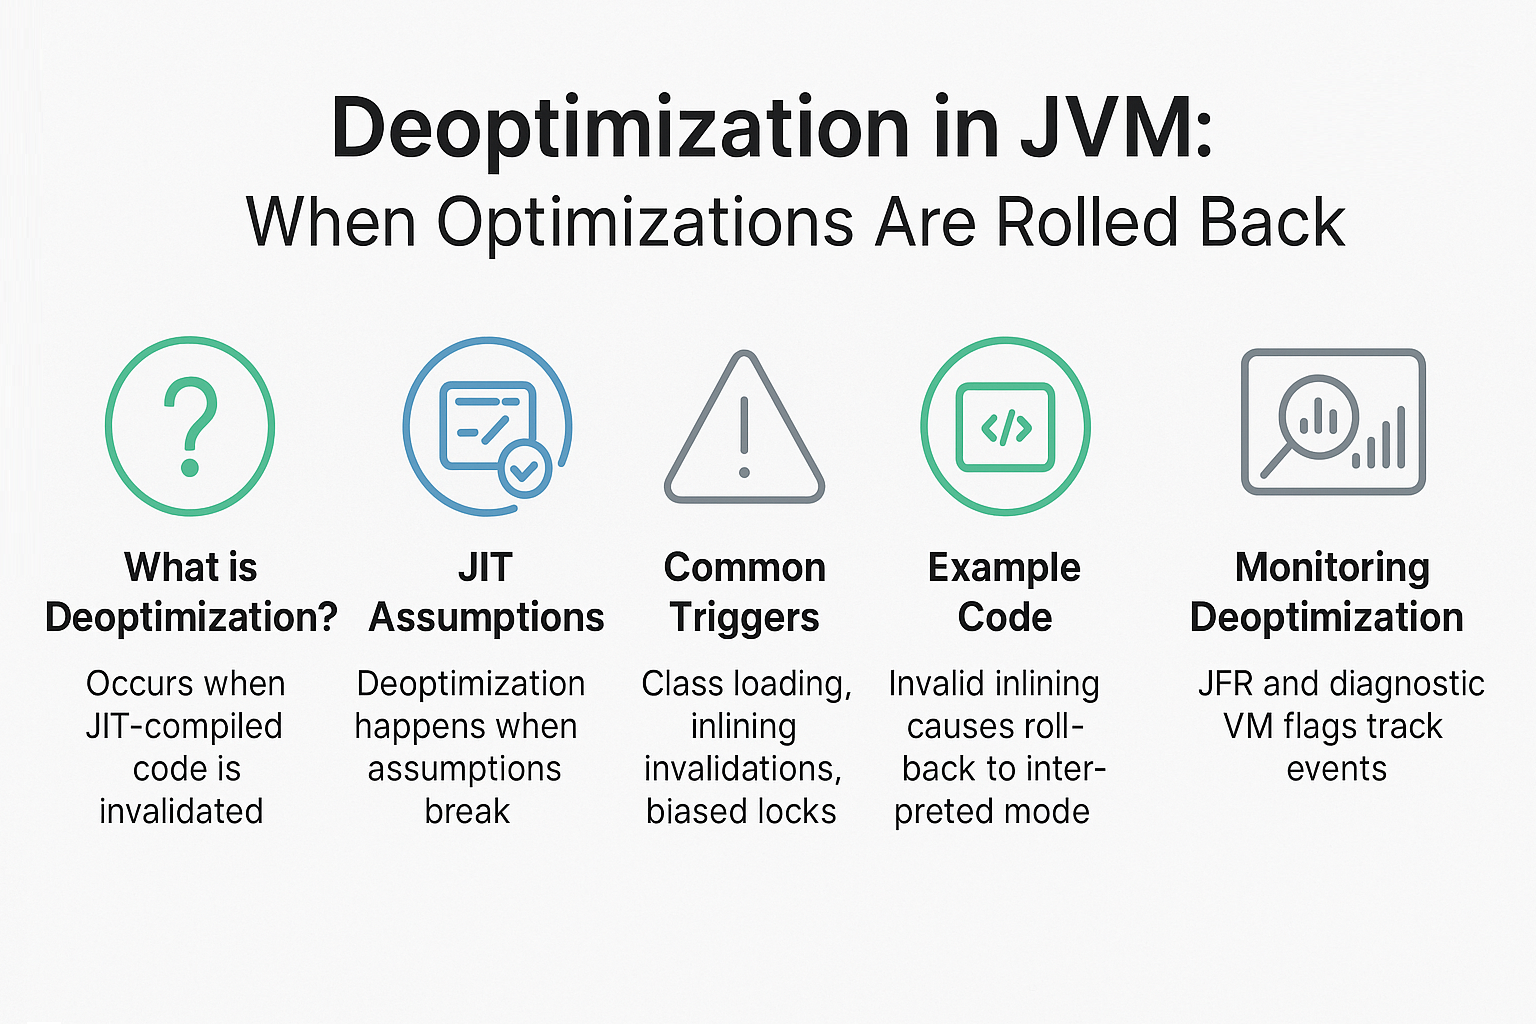
Learn JVM deoptimization, why HotSpot rolls back JIT optimizations, how it ensures correctness, and its performance impact in Java applications
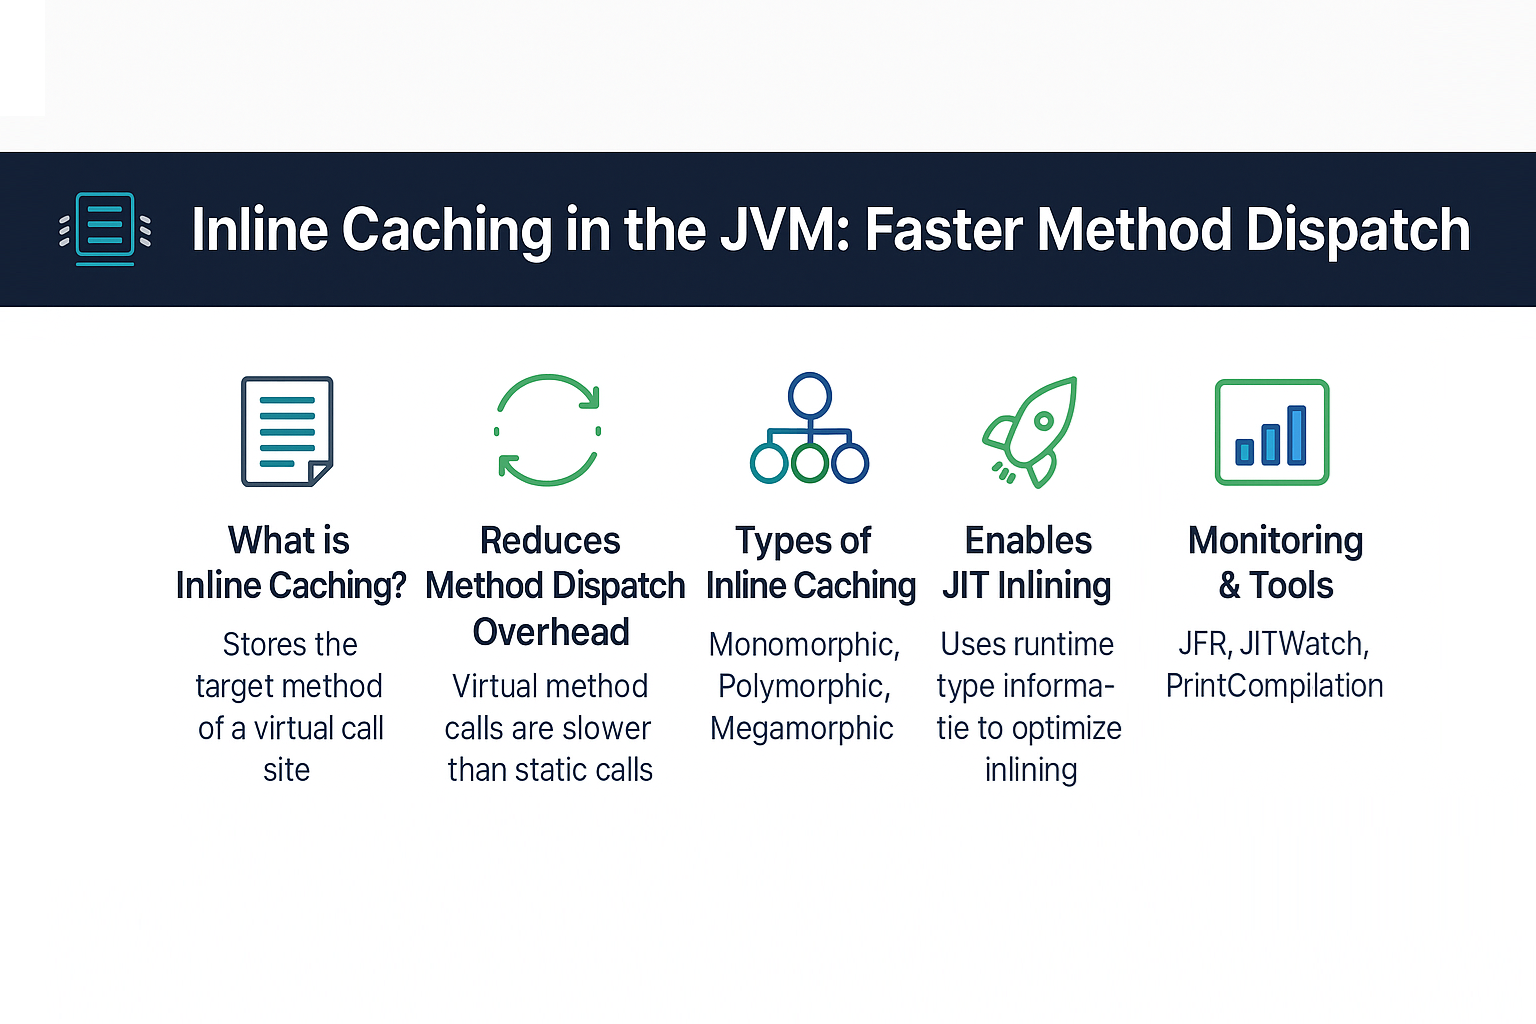
Discover how JVM inline caching accelerates method dispatch, reduces dynamic lookup overhead, and boosts Java application performance with JIT optimizations
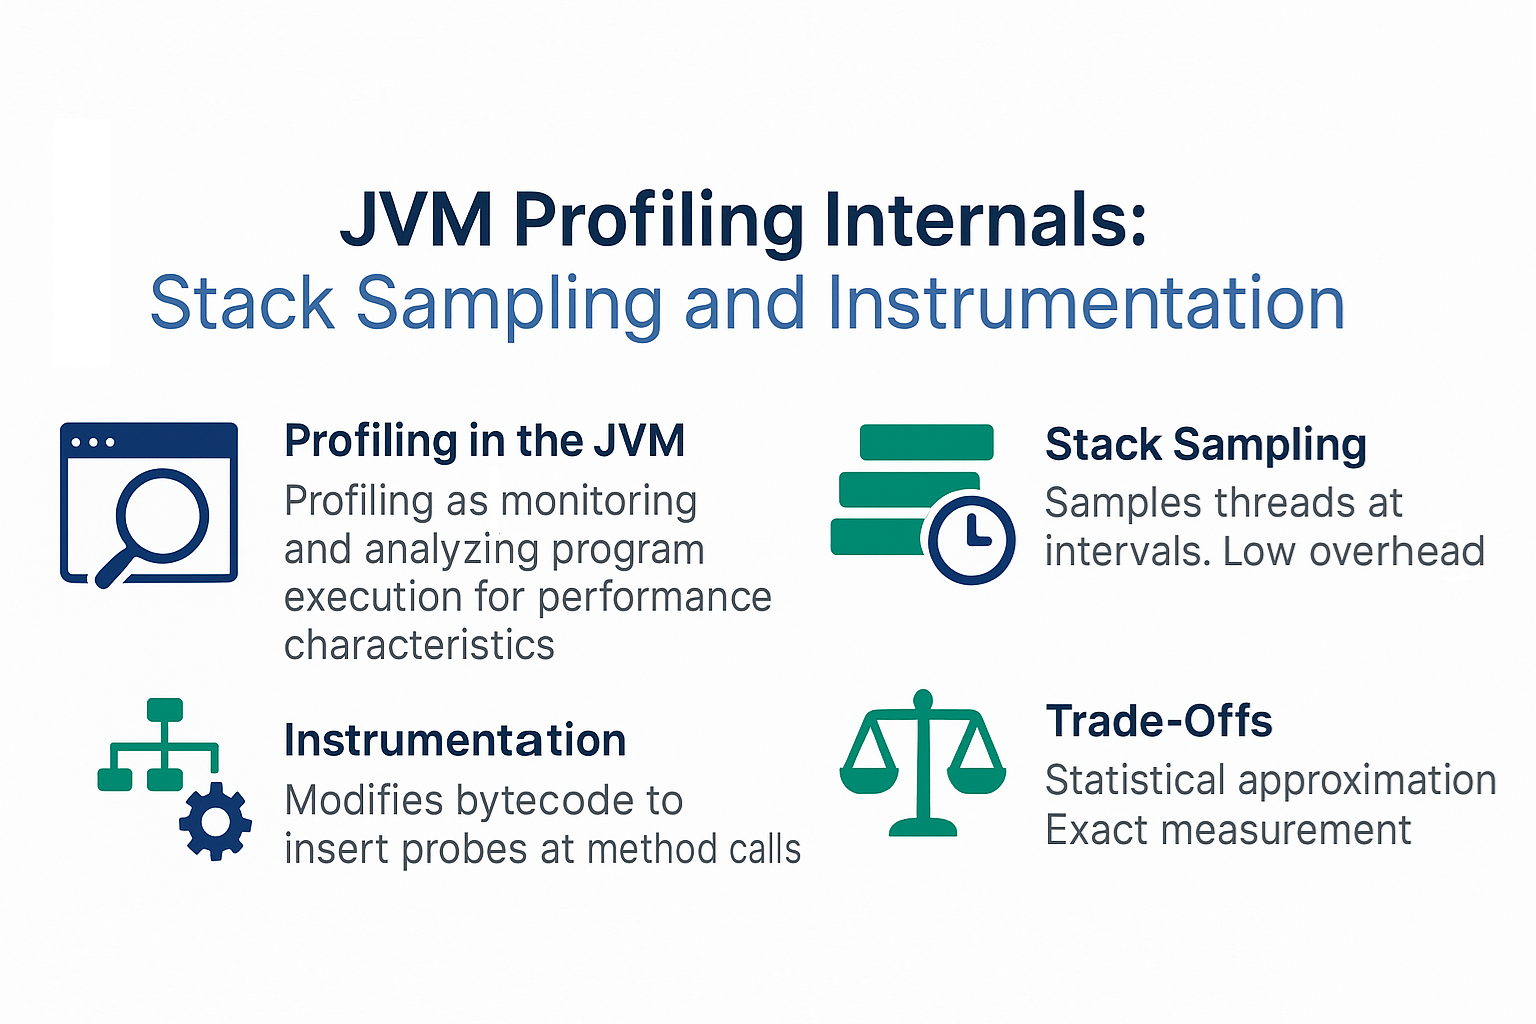
Explore JVM profiling internals with stack sampling and instrumentation. Learn how to detect performance bottlenecks and optimize Java applications in production
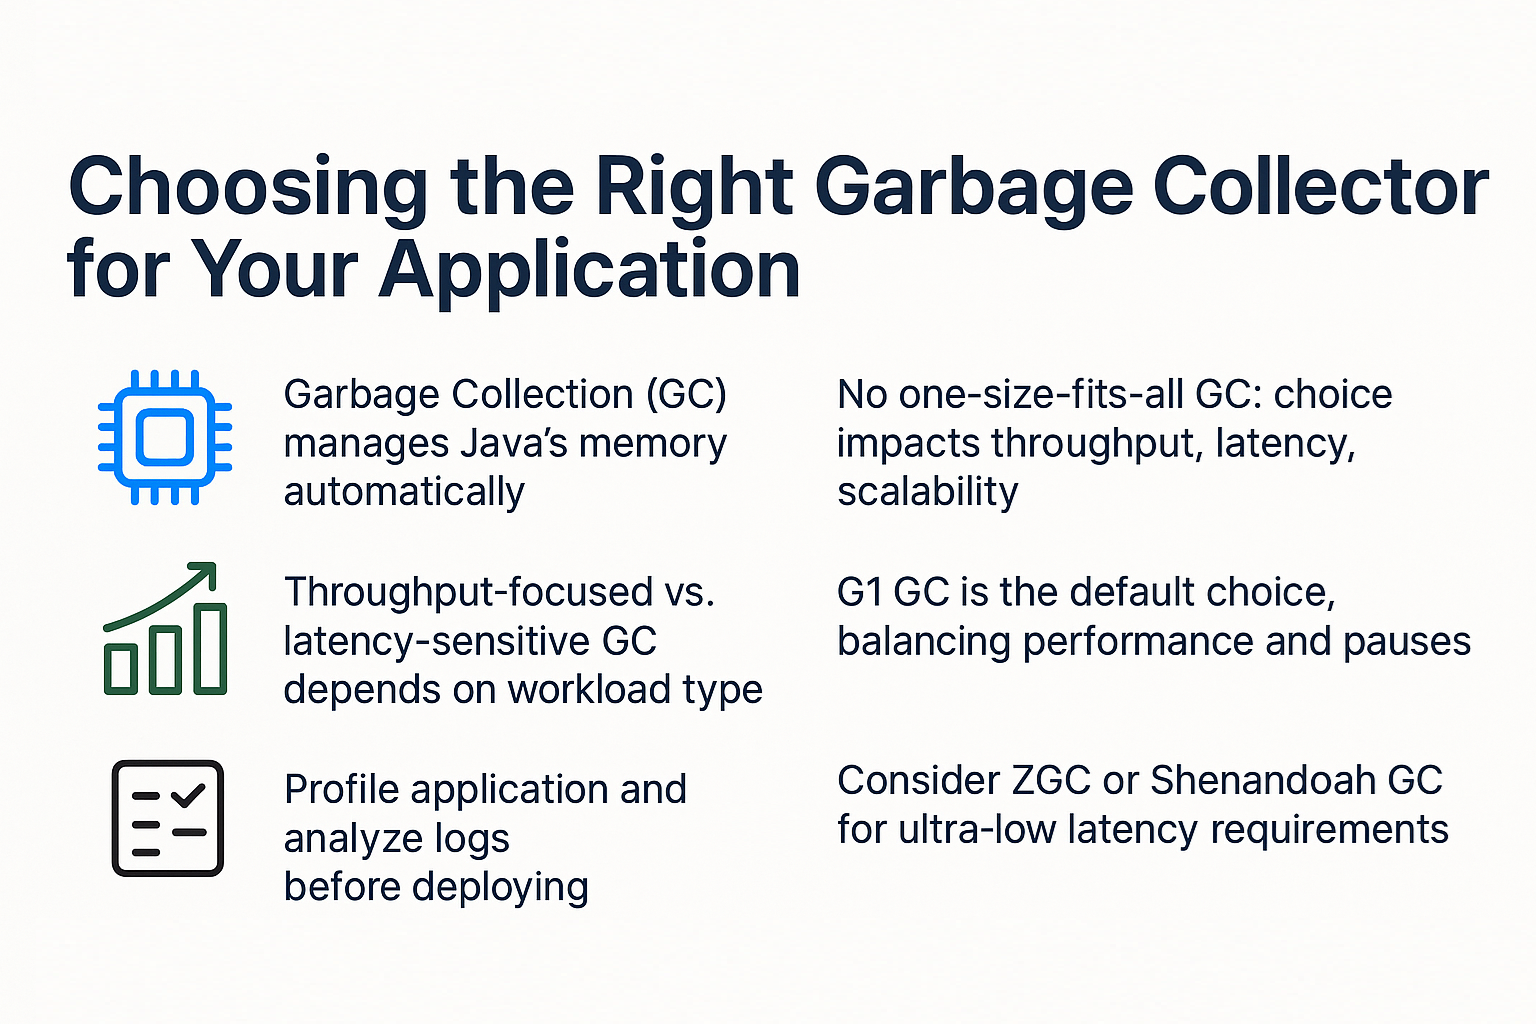
Learn how to choose the right JVM garbage collector (G1, ZGC, Shenandoah, Parallel) for your application. Compare throughput vs latency tuning with real-world cases
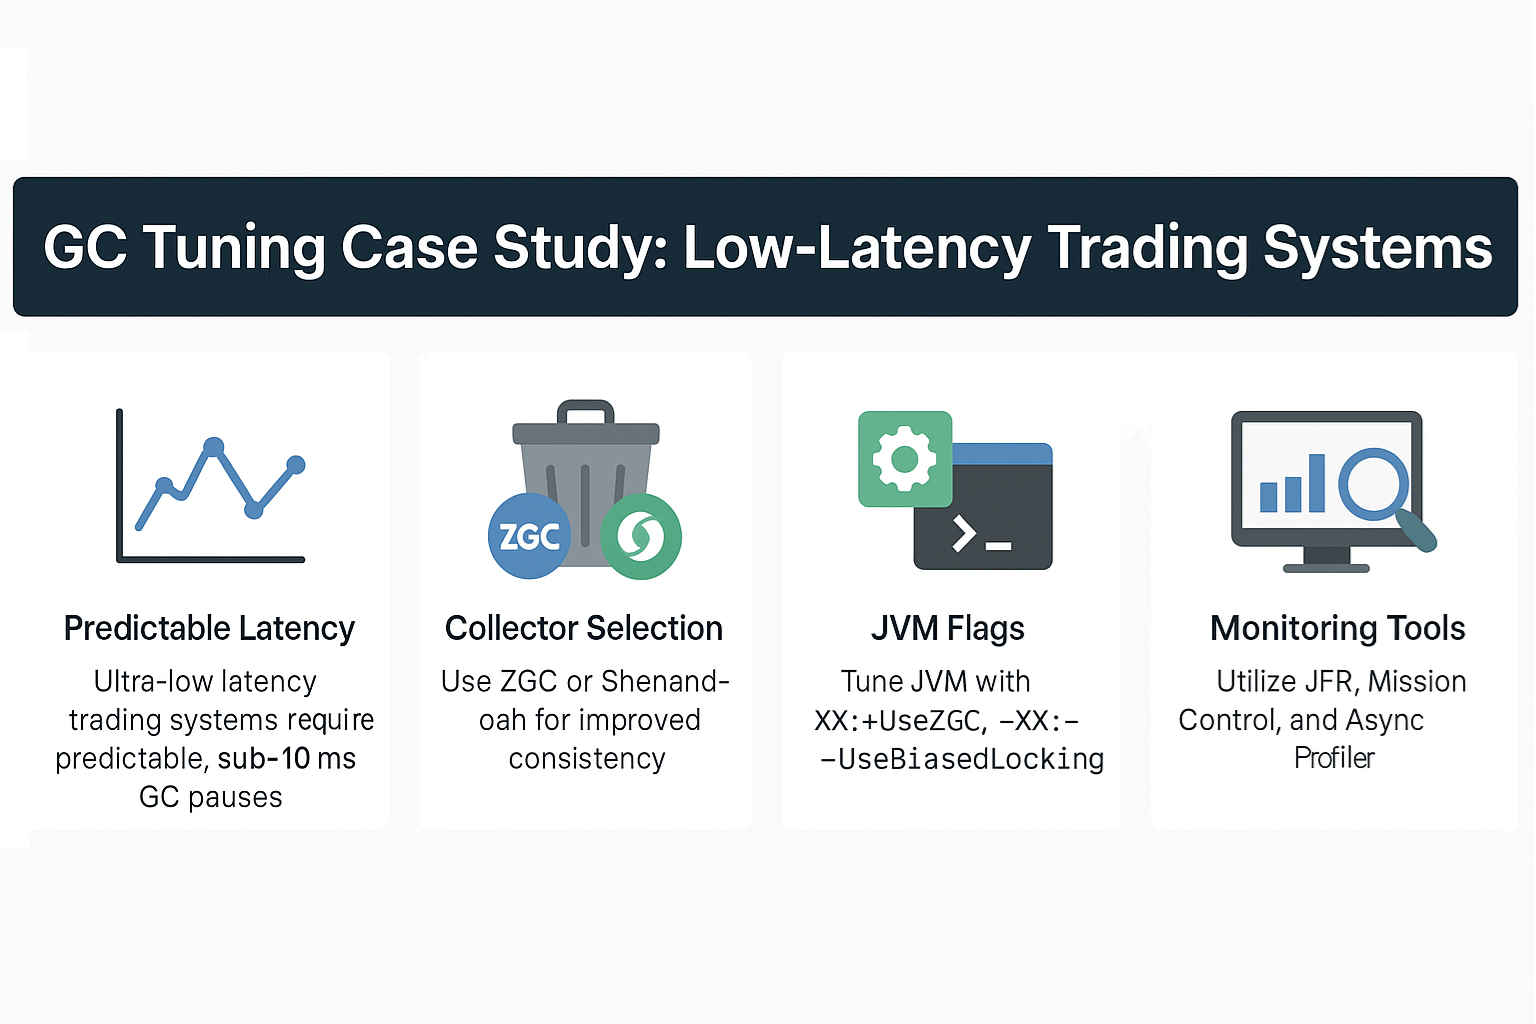
Explore a real-world GC tuning case study in low-latency trading systems. Learn how ZGC, Shenandoah, and JVM flags help achieve predictable sub-10ms pauses
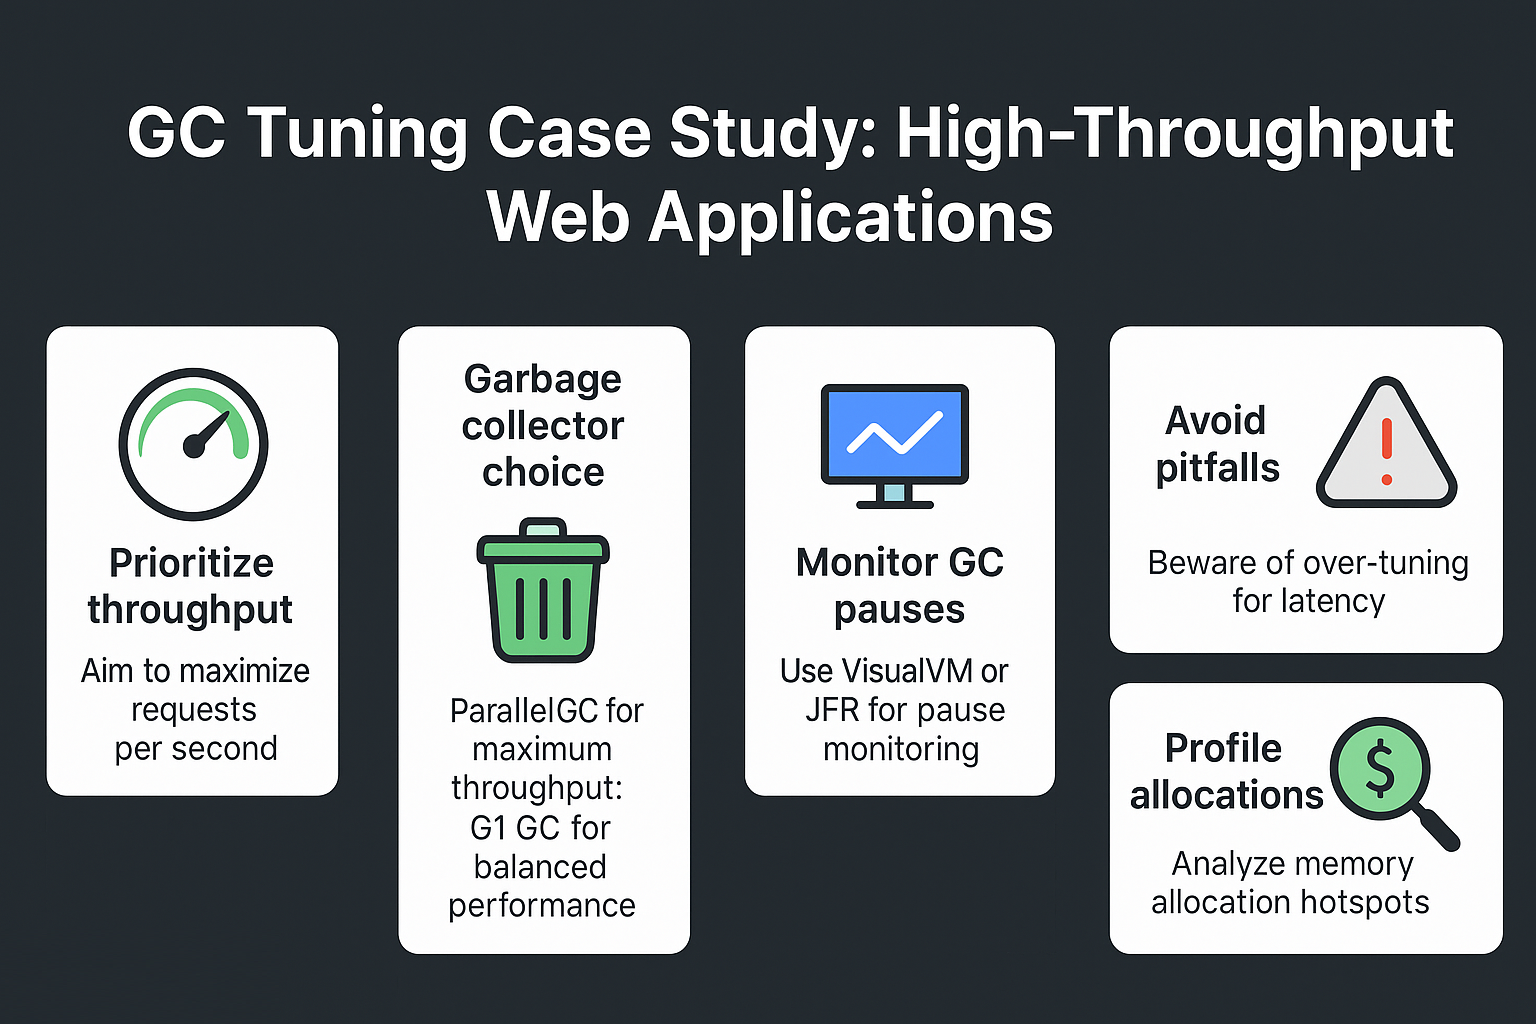
Learn GC tuning strategies for high-throughput web applications. Explore G1, Parallel, and ZGC optimization with JVM flags, case studies, and best practices
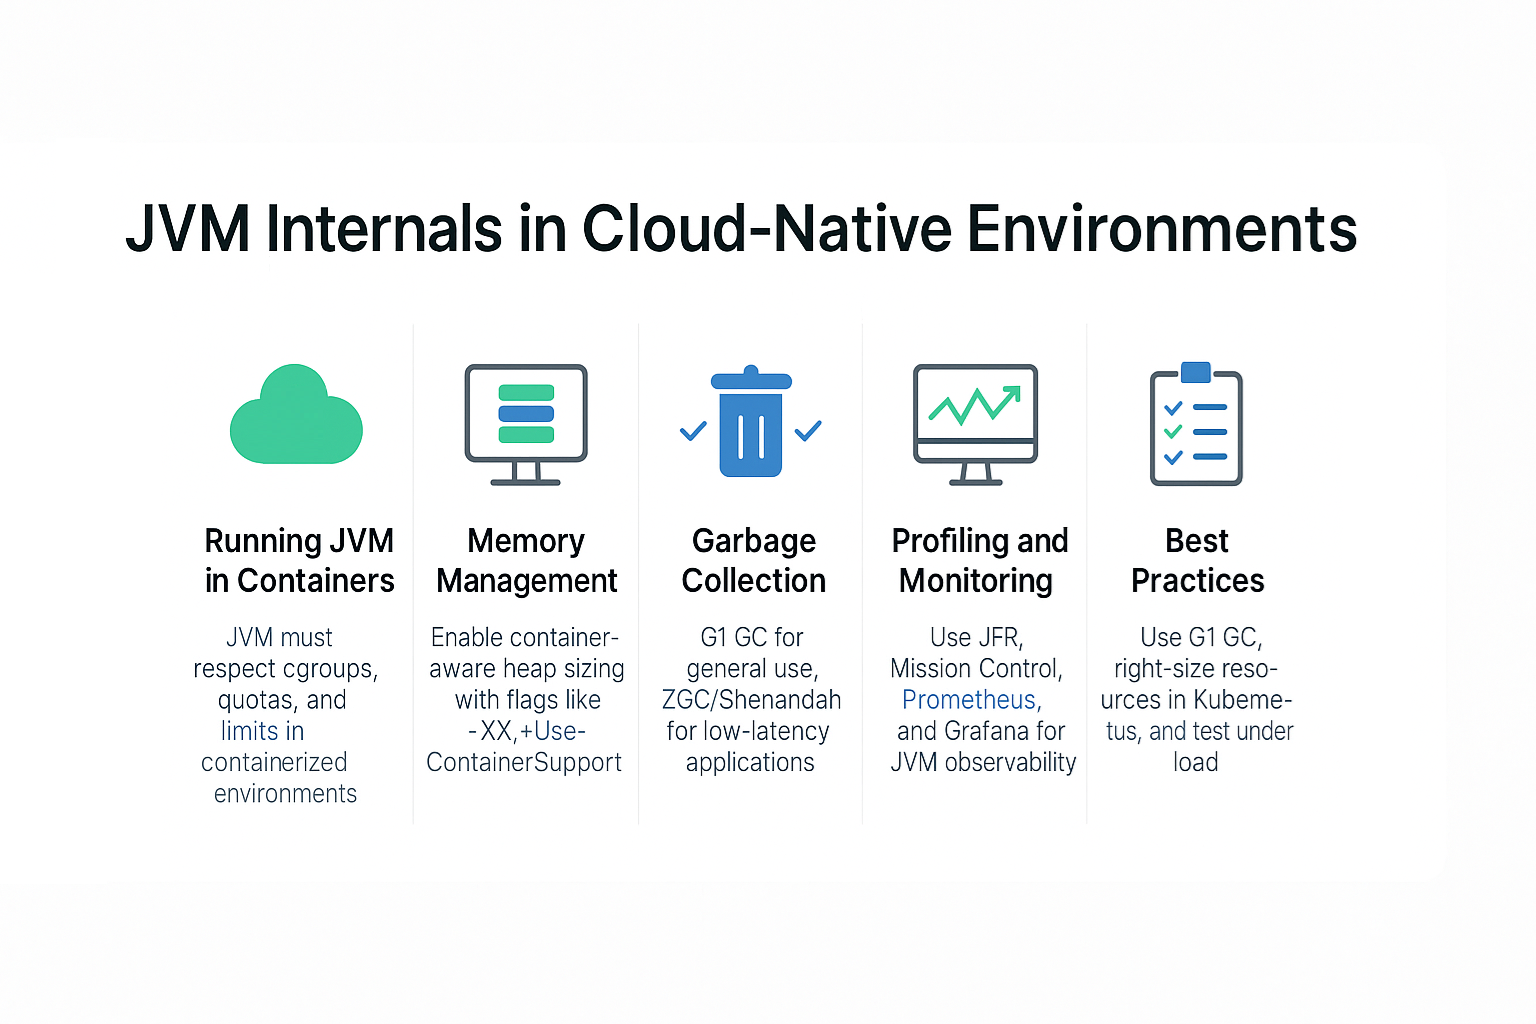
Learn JVM internals in cloud-native environments. Explore GC tuning, memory management, and best practices for Docker and Kubernetes deployments
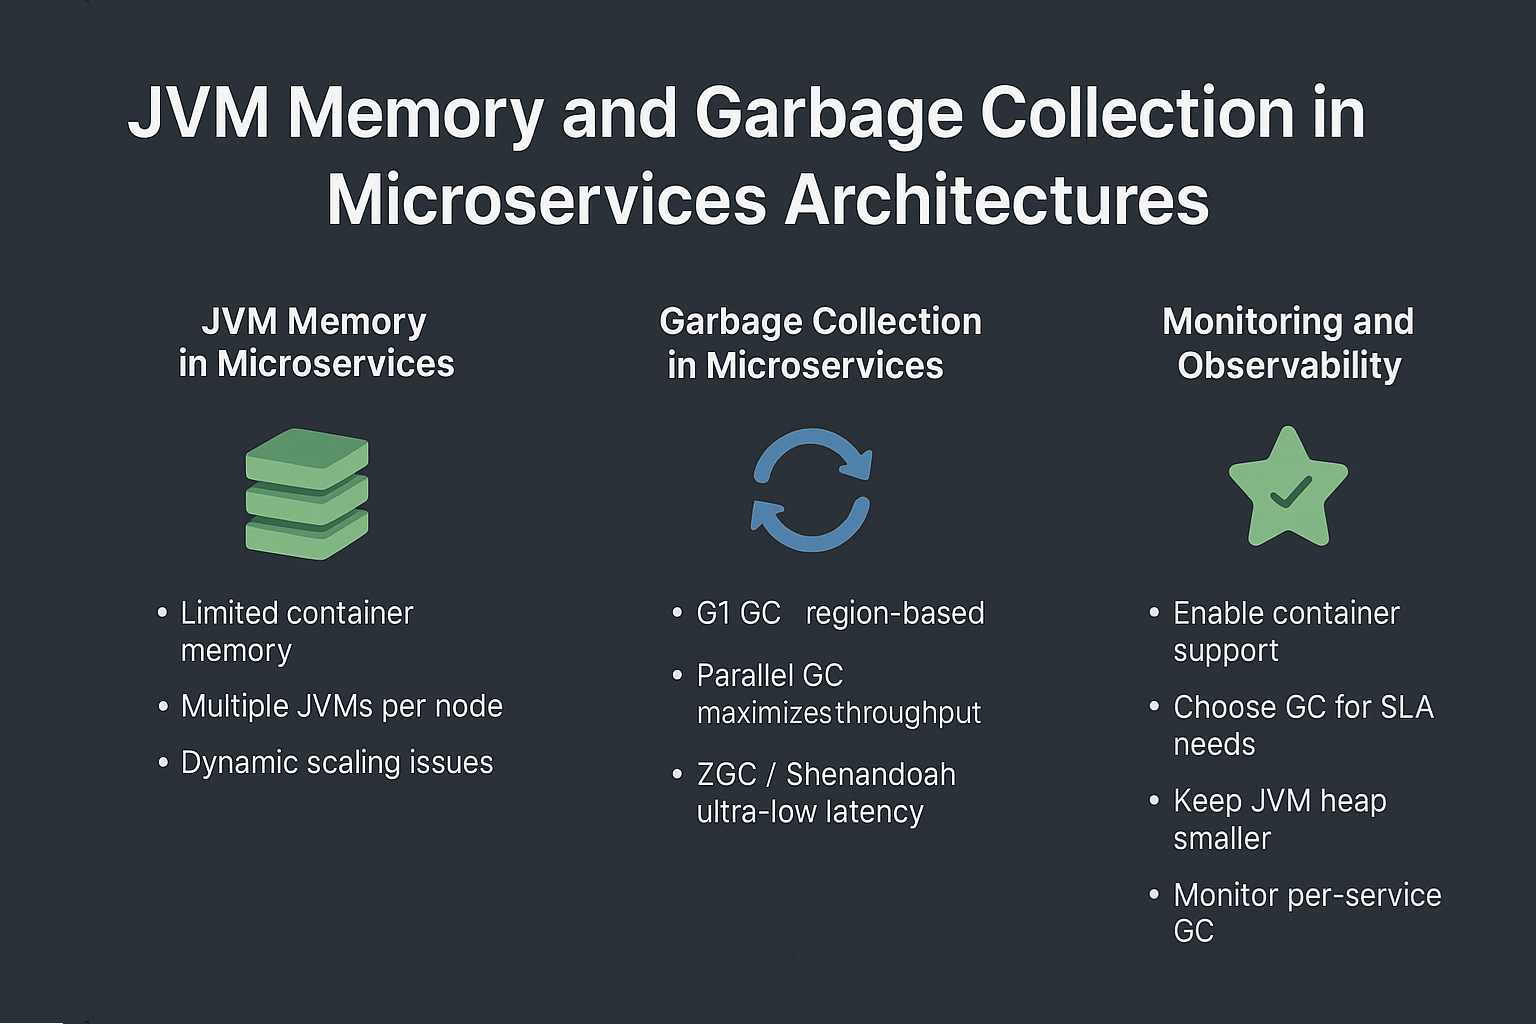
Learn how JVM memory and GC tuning affect microservices. Explore best practices for heap sizing, GC choice, and performance optimization in cloud-native systems
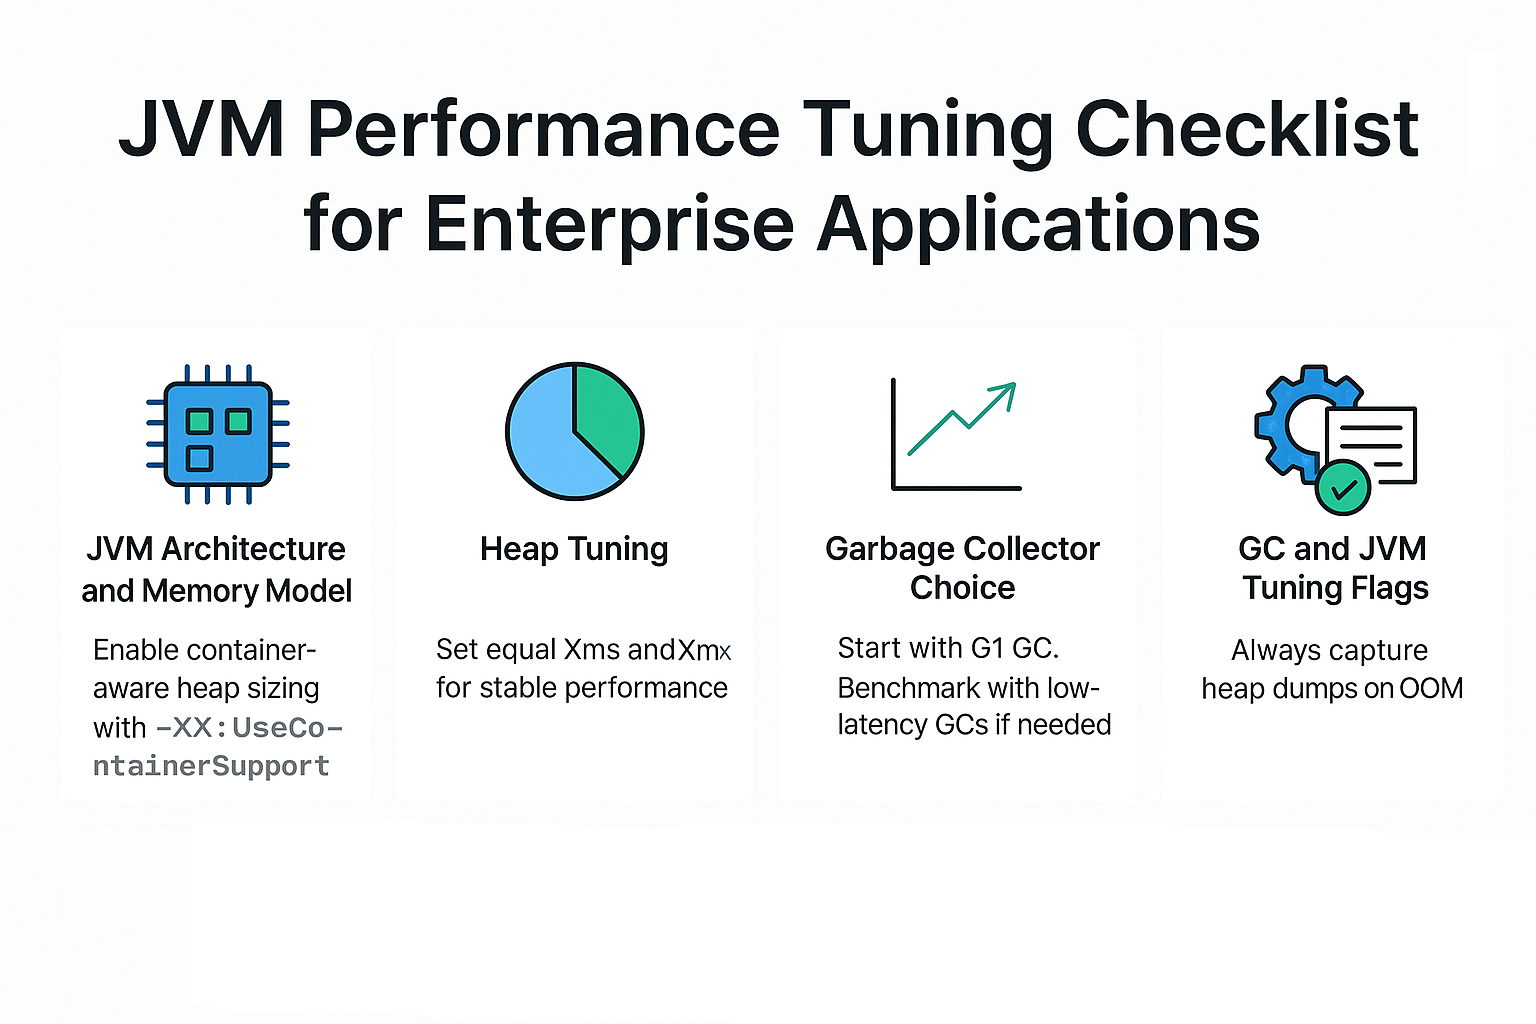
A complete JVM performance tuning checklist for enterprise apps. Covers GC, heap, JIT, monitoring, flags, and best practices for scalable production systems.
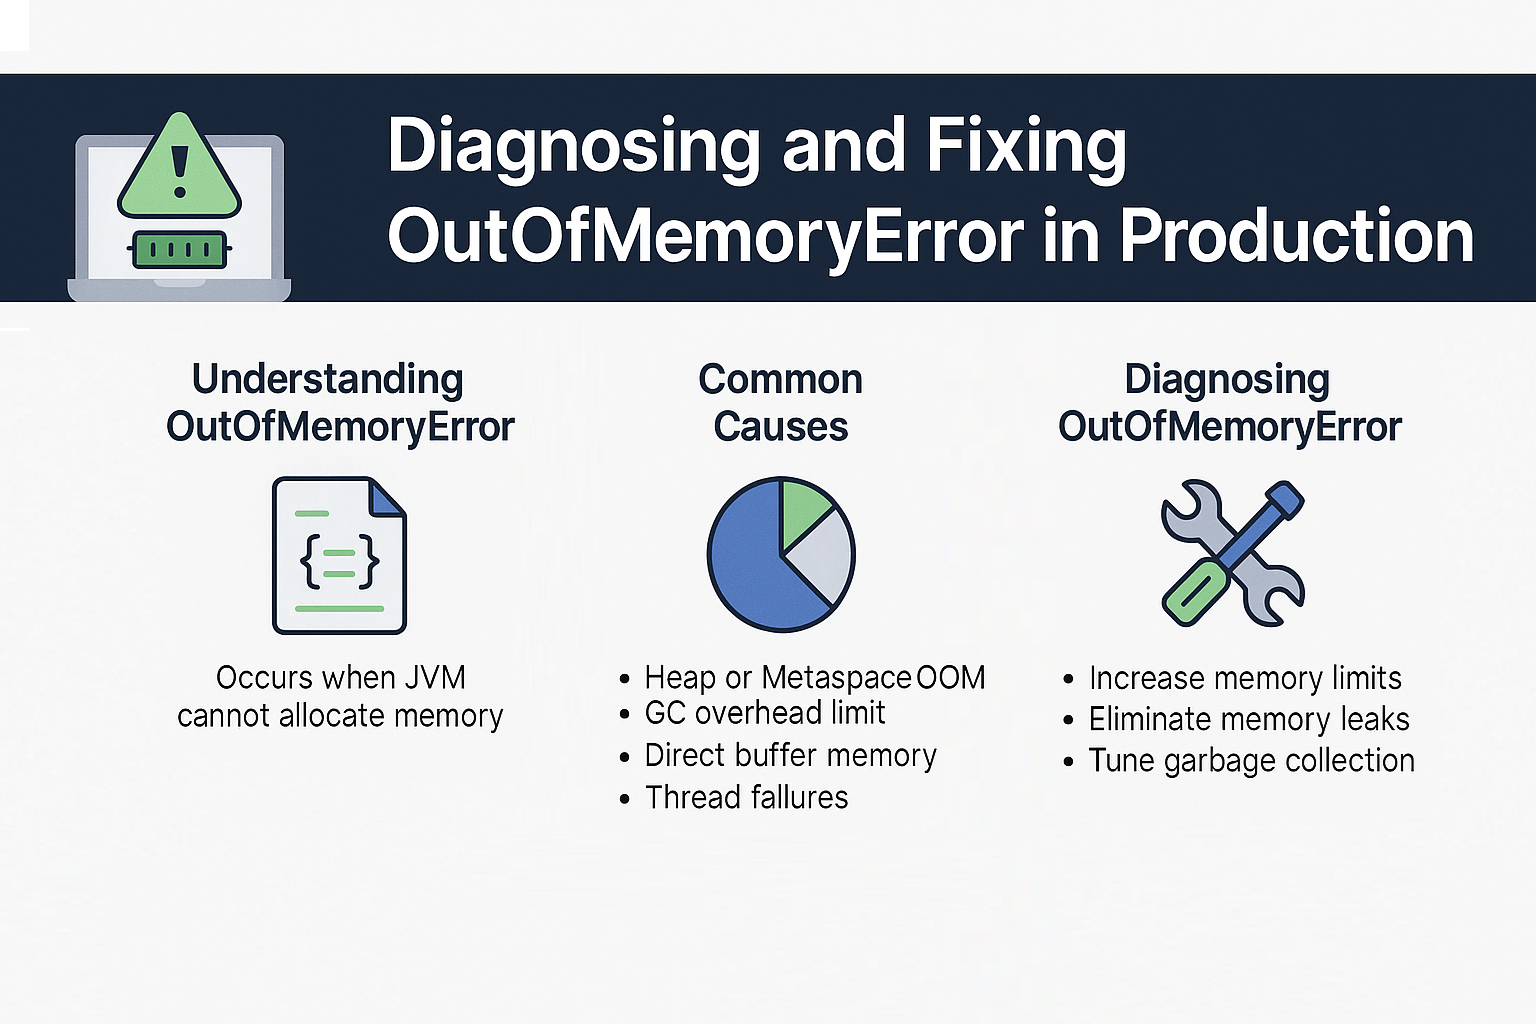
Learn how to diagnose and fix OutOfMemoryError in production Java apps. Covers causes, detection, GC tuning, memory leaks, and best practices for stability
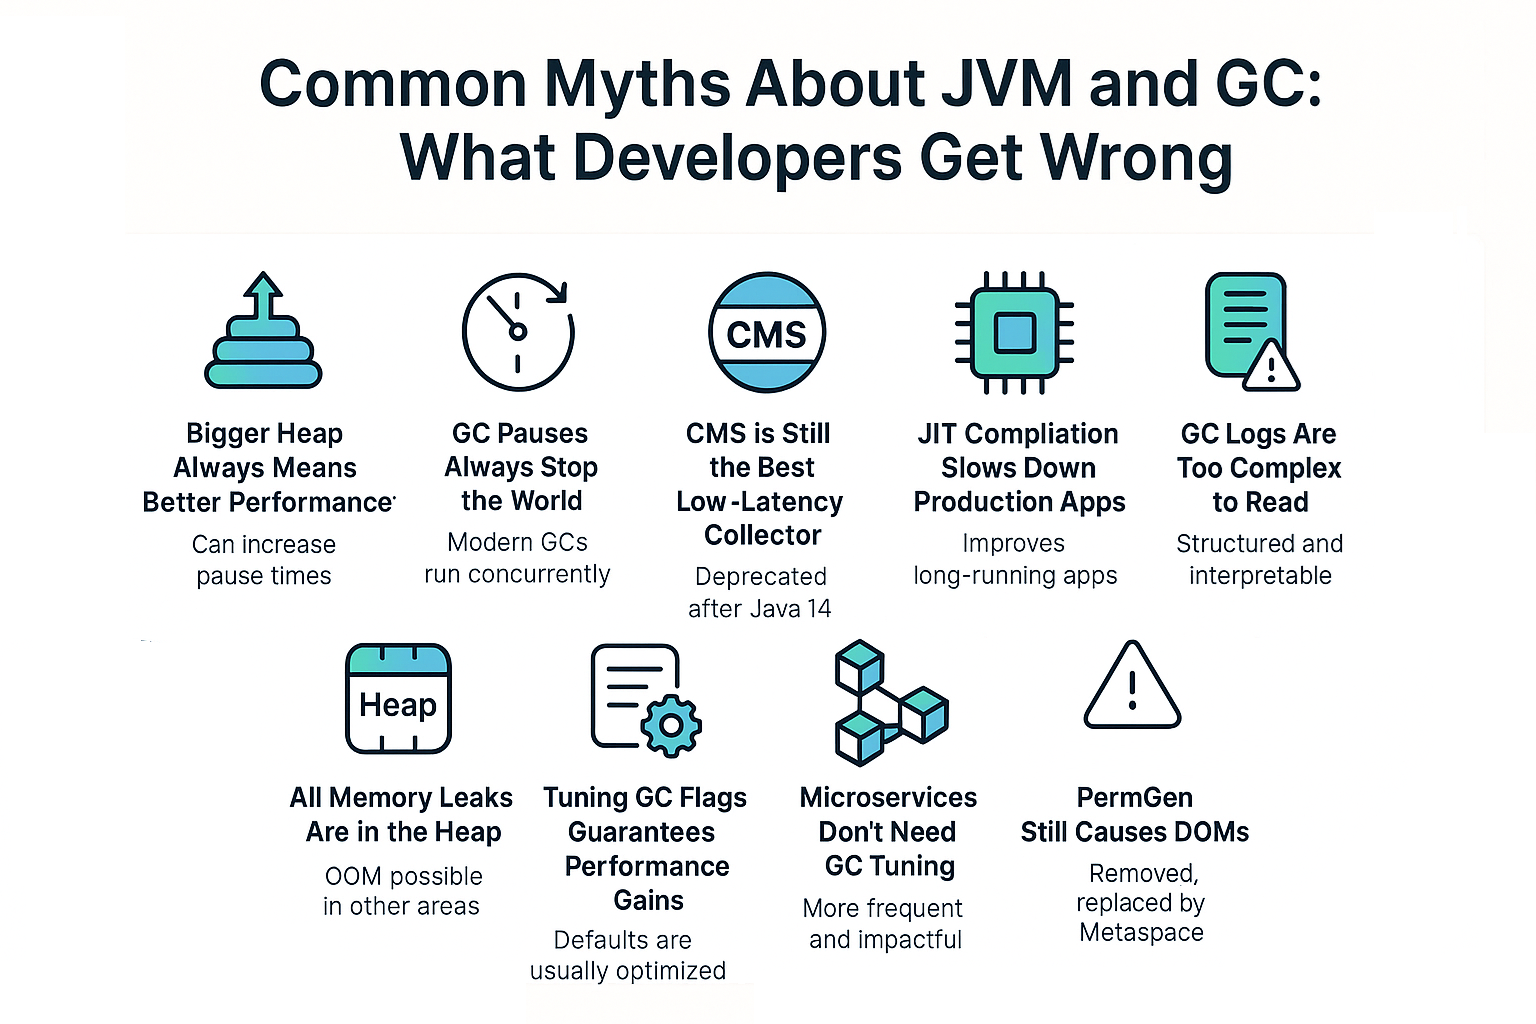
Debunk common myths about JVM and Garbage Collection. Learn the truth about heap, GC tuning, JIT, safepoints, and performance in modern Java versions
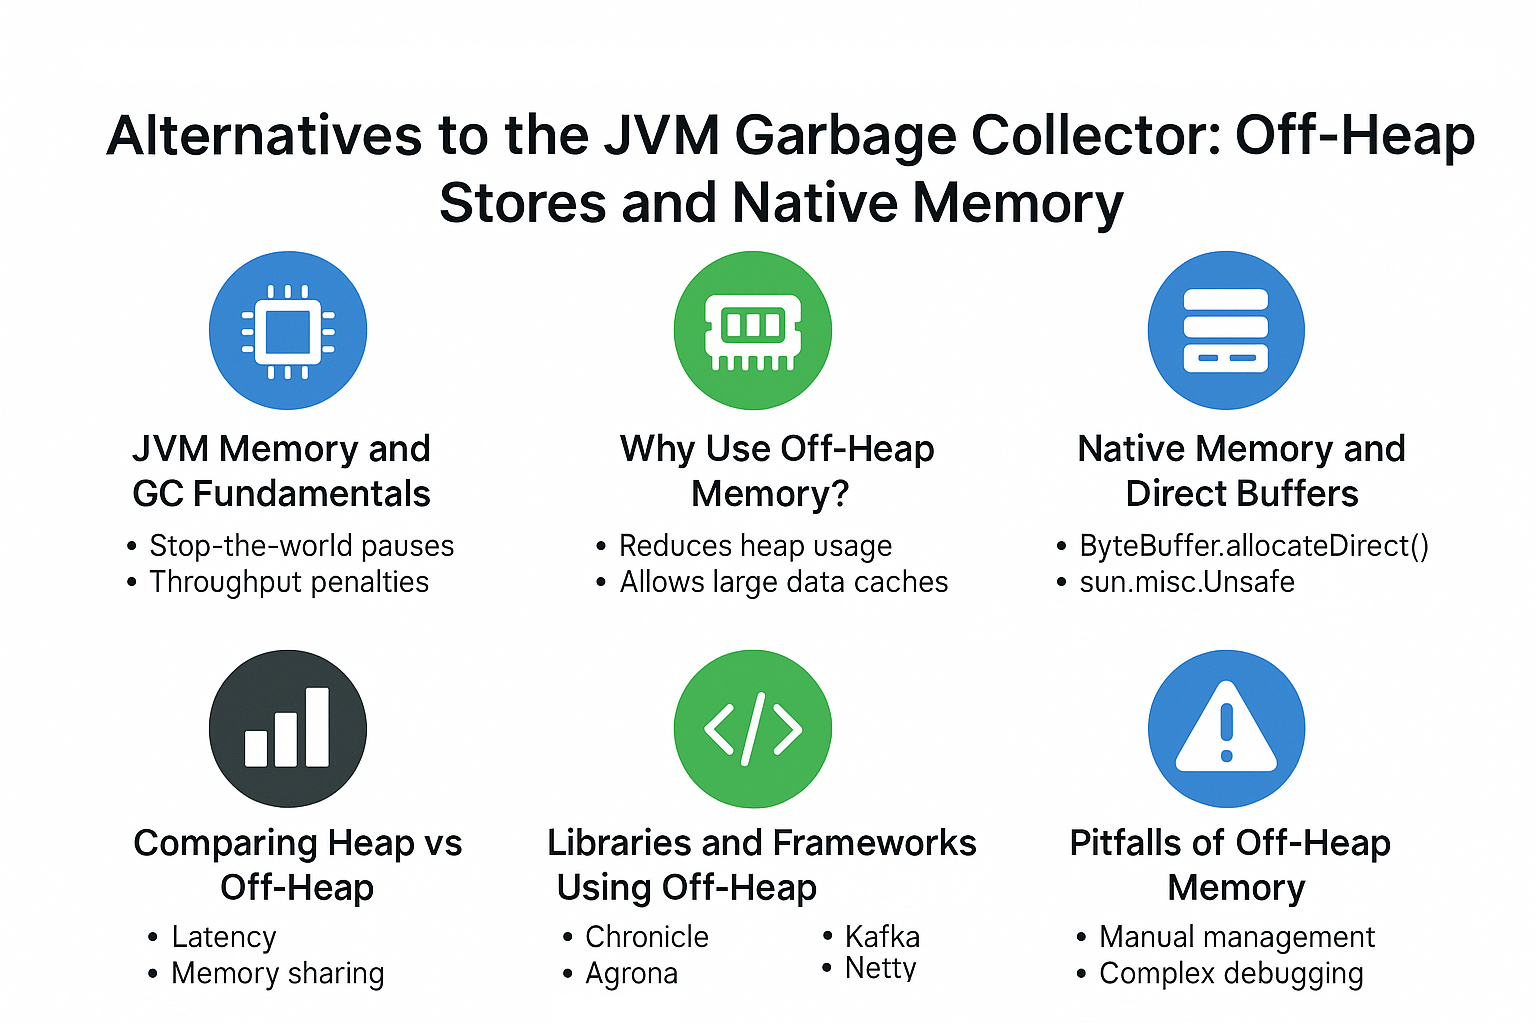
Explore alternatives to JVM Garbage Collection using off-heap stores and native memory for better performance, reduced GC pauses, and optimized workloads