One of the most important decisions when deploying a Java application is how to size the JVM heap. Too small, and you’ll hit OutOfMemoryError or frequent garbage collections. Too large, and you risk long GC pauses, wasted resources, and slow startup times.
This is where the JVM memory tuning parameters -Xms, -Xmx, and Metaspace settings come into play. These parameters control the allocation of memory for your Java process and directly impact throughput, latency, and reliability.
In this tutorial, we’ll explore what these parameters mean, how they affect the JVM, and best practices for tuning them across different environments.
JVM Memory Structure Recap
Before tuning, it’s essential to understand where these parameters fit in. The JVM memory is divided into several regions:
- Young Generation → Eden + Survivor spaces for short-lived objects.
- Old Generation (Tenured) → Stores long-lived objects.
- Metaspace (Java 8+) → Stores class metadata (replaces PermGen).
- Stack → Local variables and method calls per thread.
Garbage Collection (GC) works across these regions. Heap tuning parameters mainly control the Young + Old generations, while Metaspace requires separate tuning.
The Key Parameters
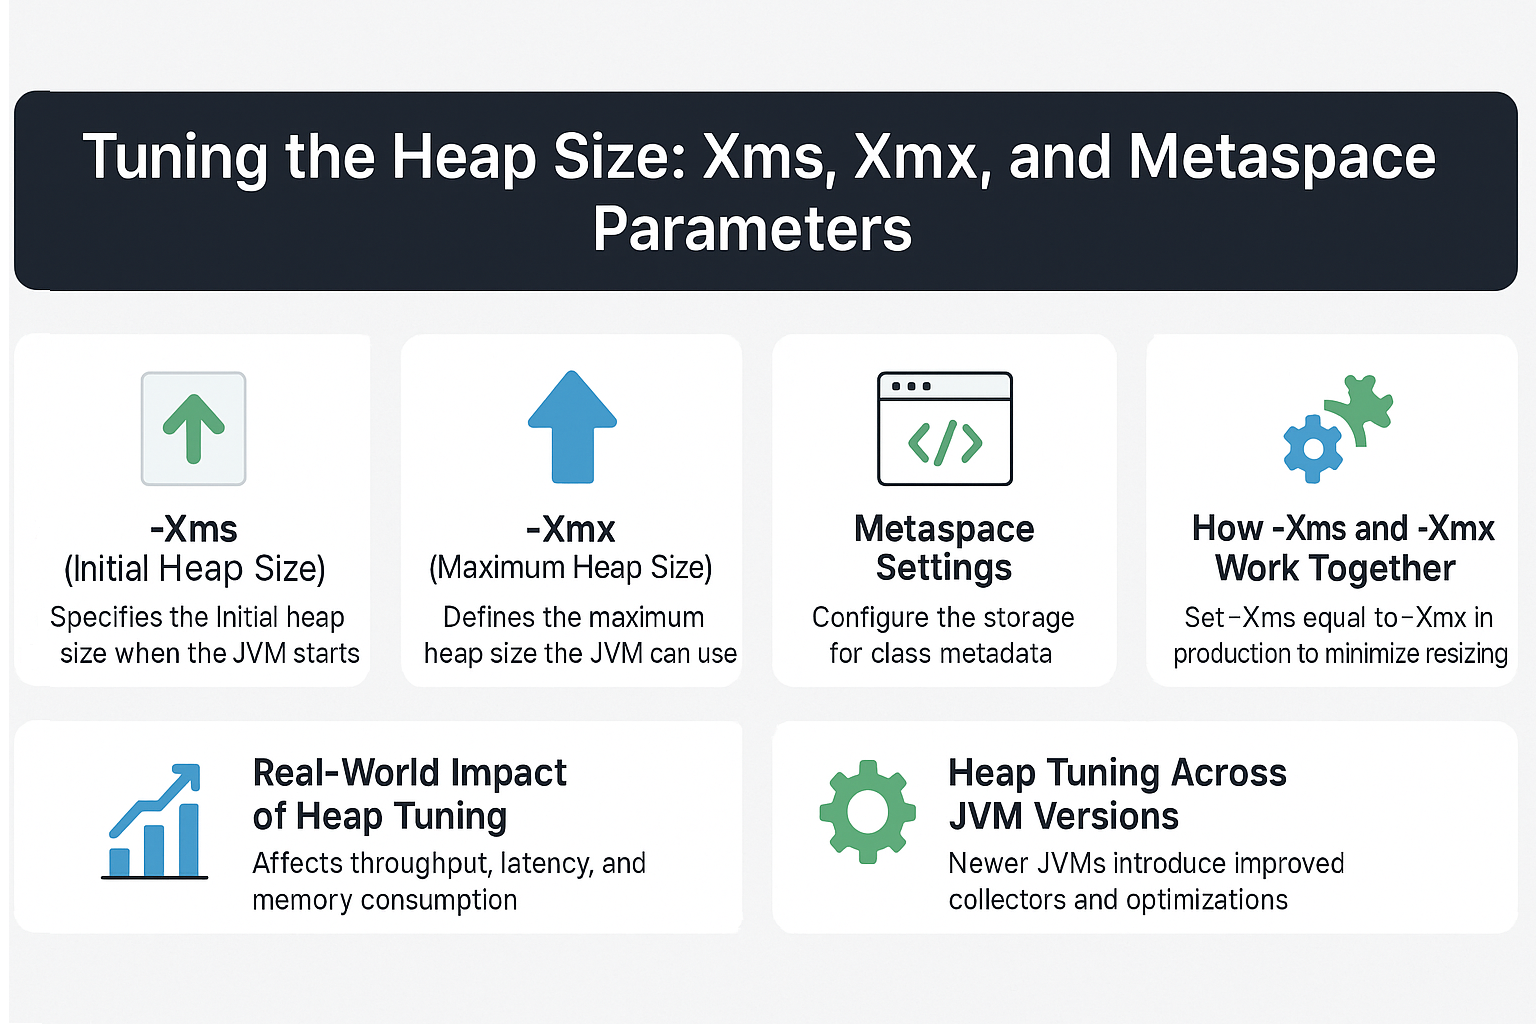
1. -Xms (Initial Heap Size)
- Defines the initial heap size when the JVM starts.
- Affects startup performance.
- If too small, the heap may need to resize early, causing GC overhead.
Example:
java -Xms512m MyApp
2. -Xmx (Maximum Heap Size)
- Defines the maximum heap size the JVM can grow to.
- Prevents unbounded memory growth.
- Too small → frequent GCs.
- Too large → long GC pauses.
Example:
java -Xmx4g MyApp
3. Metaspace Settings
- Introduced in Java 8, replacing PermGen.
- Stores class metadata like method definitions and reflection data.
- By default, it grows dynamically, but you can limit it.
Key flags:
-XX:MetaspaceSize=256m
-XX:MaxMetaspaceSize=1g
How Xms and Xmx Work Together
- Best practice: Set
-Xmsequal to-Xmxin production.- Prevents resizing overhead.
- Ensures predictable GC performance.
Example:
java -Xms4g -Xmx4g -XX:MaxMetaspaceSize=1g MyApp
Real-World Impact of Heap Tuning
Case 1: Too Small Heap
- Frequent GC cycles.
- Increased CPU usage.
- Possible
OutOfMemoryError.
Case 2: Too Large Heap
- Long GC pauses.
- High memory consumption.
- Risk of hitting OS limits in containerized environments (Docker/K8s).
Case 3: Well-Tuned Heap
- Balanced throughput and latency.
- Minimal GC pauses.
- Stable memory usage even under load.
Heap Tuning Across JVM Versions
- Java 8 → Parallel GC default; Metaspace introduced.
- Java 11 → G1 GC default; improved memory efficiency.
- Java 17 → ZGC and Shenandoah available for ultra-low-latency.
- Java 21+ → ZGC stable, NUMA-aware scaling for large heaps.
GC Algorithms and Heap Sizing
- Parallel GC → Works best with larger heaps for throughput.
- G1 GC → Requires balanced heap sizes for predictable pause times.
- ZGC/Shenandoah → Support very large heaps with low pause times; resizing less critical but still relevant.
Tuning in Containers (Docker/Kubernetes)
When running in containers, beware of:
- Cgroup memory limits → JVM may think it has more memory than allocated.
- Always set explicit
-Xmxvalues. - Use flags like:
-XX:+UseContainerSupport (Java 10+)
Pitfalls and Troubleshooting
- Forgetting to cap Metaspace → Risk of unbounded memory usage.
- Setting
-Xmxtoo high → GC pauses become unpredictable. - Not tuning in microservices → Leads to noisy-neighbor issues in shared clusters.
- Ignoring GC logs → Hard to validate tuning.
Best Practices
- Start with heap = 50–70% of available system RAM.
- Always monitor GC logs alongside tuning.
- Use JVisualVM, JConsole, or JFR to validate behavior.
- In production, set
-Xms = -Xmx. - Cap Metaspace with
-XX:MaxMetaspaceSizeto prevent leaks.
Example Java Code with GC Monitoring
public class HeapTuningExample {
    public static void main(String[] args) {
        for (int i = 0; i < 1000000; i++) {
            String data = new String("HeapTest" + i);
        }
        System.out.println("Heap tuning demo complete!");
    }
}
Run with:
java -Xms512m -Xmx1g -XX:MaxMetaspaceSize=256m -Xlog:gc* HeapTuningExample
You’ll see GC logs showing how the JVM handles allocations.
Conclusion & Key Takeaways
Heap tuning is both an art and a science. By adjusting -Xms, -Xmx, and Metaspace settings, you can:
- Avoid
OutOfMemoryError. - Optimize GC performance.
- Balance throughput and latency.
- Run stable applications across environments.
FAQ
1. What is the JVM memory model and why does it matter?
It governs memory regions and thread interaction, ensuring GC correctness.
2. How does G1 GC differ from CMS?
G1 is region-based with predictable pauses; CMS was concurrent but fragmented.
3. When should I use ZGC or Shenandoah?
When ultra-low-latency is critical and heap sizes are large.
4. What are JVM safepoints and why do they matter?
They are points where all threads pause so GC can safely operate.
5. How do I solve OutOfMemoryError in production?
Check heap/Metaspace usage, tune -Xmx, fix leaks, and analyze GC logs.
6. What are the trade-offs of throughput vs latency tuning?
Throughput tuning favors fewer but longer GCs; latency tuning favors shorter, more frequent pauses.
7. How do I read and interpret GC logs?
Look for heap before/after sizes, pause times, and promotion rates.
8. How does JIT compilation optimize performance?
JIT compiles hot code paths, reducing interpretation overhead.
9. What’s the future of GC in Java (Project Lilliput)?
Smaller object headers = more efficient heap usage.
10. How does GC differ in microservices vs monoliths?
Microservices prioritize latency and memory efficiency; monoliths often prioritize throughput.
