Java’s automatic Garbage Collection (GC) gives developers a sense of safety—objects without references are reclaimed automatically. Yet, many production systems still crash with OutOfMemoryError or slow down due to hidden memory leaks.
Unlike native languages like C or C++, memory leaks in Java don’t occur from failing to free memory explicitly. Instead, they occur when objects remain reachable from GC roots but are no longer actually needed by the application. These leaks cause heap bloat, higher GC pressure, and unpredictable performance.
This tutorial explains the causes, detection techniques, and prevention strategies for memory leaks in Java, with practical examples and best practices for production environments.
What is a Memory Leak in Java?
A memory leak happens when an object is no longer used but is still reachable from GC roots, preventing the JVM from reclaiming its memory.
Example:
import java.util.*;

public class MemoryLeakExample {
    private static List<String> cache = new ArrayList<>();

    public static void main(String[] args) {
        for (int i = 0; i < 1000000; i++) {
            cache.add("Leak-" + i); // grows indefinitely
        }
        System.out.println("Done!");
    }
}
Here, cache grows indefinitely because references are retained in a static collection, leading to a memory leak.
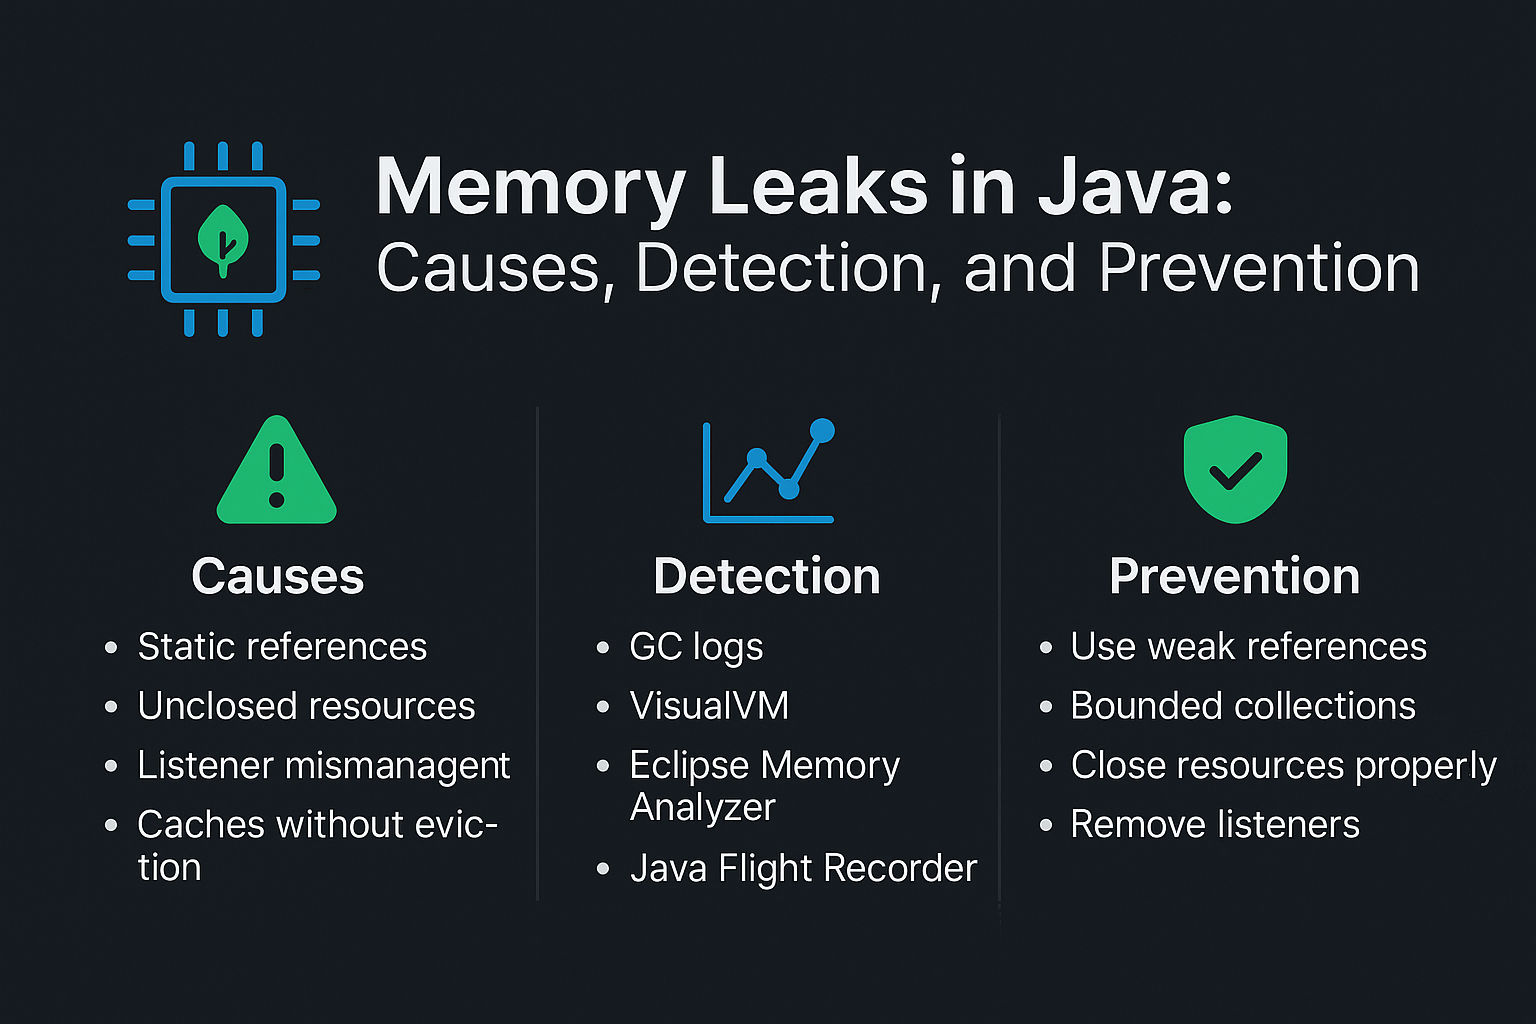
Common Causes of Memory Leaks
1. Static References
- Long-lived static fields holding large collections.
- Cause: Objects remain reachable even after use.
2. Unclosed Resources
- File handles, sockets, database connections not closed.
- Cause: Retained by OS or library references.
3. Listener or Callback Mismanagement
- Event listeners registered but never removed.
- Cause: Strong references prevent GC.
4. Caches Without Eviction
- Using
HashMaporArrayListas a cache. - Cause: No removal strategy.
5. Inner Classes Holding Outer References
- Anonymous inner classes retain reference to enclosing instance.
6. ThreadLocal Misuse
- ThreadLocal values not cleaned up → memory leaks in thread pools.
7. ClassLoader Leaks
- Common in web servers (Tomcat, JBoss).
- Caused by classes and resources not being unloaded.
Detecting Memory Leaks
GC Logs
- Monitor frequent Full GC events.
- Symptom: GC runs often but heap usage never decreases.
VisualVM
- Attach to JVM.
- Inspect heap dumps.
- Look for large retained objects.
Eclipse Memory Analyzer (MAT)
- Analyze heap dumps.
- Dominator tree analysis highlights leak suspects.
Java Flight Recorder (JFR) + Mission Control
- Low-overhead profiling in production.
- Detect allocation hotspots and leaks.
Example: GC Log Symptom
[Full GC (Ergonomics) 512M->510M(1024M), 2.3456789 secs]
Heap barely shrinks after GC → indicates leak.
Preventing Memory Leaks
Use Weak/Soft References
- For caches:
Map<String, WeakReference<Object>> cache = new HashMap<>();
Use Bounded Collections
- Replace
HashMapwithLinkedHashMap+ eviction policy. - Or use
Caffeine/Guava Cache.
Close Resources Properly
- Always use try-with-resources.
try (FileInputStream fis = new FileInputStream("data.txt")) {
    // use resource
}
Remove Listeners
- Always unregister event listeners when no longer needed.
ThreadLocal Hygiene
- Call
remove()when done:threadLocal.remove();
Monitor in CI/CD
- Run memory leak detection in staging under production-like load.
JVM Version Tracker and Memory Management Evolution
- Java 8 → Metaspace replaces PermGen, reduces classloader leaks.
- Java 11 → G1 default GC improves memory compaction.
- Java 17 → ZGC and Shenandoah provide low-pause, concurrent GC.
- Java 21+ → NUMA-aware GC + Project Lilliput reduces object headers.
Case Studies
Case 1: Static Cache Leak
- Issue: API service crashed with OOM.
- Diagnosis: Static
HashMapwithout eviction. - Solution: Introduced
Caffeinecache with TTL eviction. - Result: Memory stabilized, latency improved.
Case 2: ThreadLocal Leak in Web App
- Issue: Tomcat app leaking memory on redeploy.
- Diagnosis: ThreadLocal not cleared in thread pool.
- Solution: Explicit
ThreadLocal.remove(). - Result: Leak eliminated.
Case 3: Listener Leak in GUI App
- Issue: Swing app grew memory usage continuously.
- Diagnosis: Event listeners not removed.
- Solution: Proper deregistration logic added.
- Result: Heap stabilized.
Best Practices
- Always profile apps with heap dumps before production rollout.
- Cap caches and use eviction strategies.
- Clean up listeners, callbacks, and ThreadLocals.
- Monitor with GC logs and JFR in production.
- Test under production-like workloads.
Conclusion & Key Takeaways
Memory leaks in Java are subtle but dangerous.
- They don’t break the app immediately but degrade performance over time.
- Detection requires GC logs, heap dumps, and profiling tools.
- Prevention involves proper coding practices, resource management, and monitoring.
By understanding and managing memory leaks, you ensure stable, performant, and production-ready Java applications.
FAQ
1. What is the JVM memory model and why does it matter?
It defines memory areas like heap, stack, and metaspace—critical for detecting leaks.
2. How does G1 GC differ from CMS?
G1 prevents fragmentation with compaction; CMS suffered from leaks due to fragmentation.
3. When should I use ZGC or Shenandoah?
For apps requiring low-latency and handling large heaps.
4. What are JVM safepoints and why do they matter?
GC and JIT rely on safepoints to pause threads consistently.
5. How do I solve OutOfMemoryError in production?
Check GC logs, heap dumps, analyze leaks, tune -Xmx.
6. What are the trade-offs of throughput vs latency tuning?
Throughput tuning maximizes work done; latency tuning ensures predictable pauses.
7. How do I read and interpret GC logs?
Check heap before/after sizes, pause times, and GC frequency.
8. How does JIT compilation optimize performance?
Compiles frequently used methods, improving performance over time.
9. What’s the future of GC in Java (Project Lilliput)?
Smaller object headers → reduced memory footprint, fewer leaks.
10. How does GC differ in microservices vs monoliths?
Microservices need predictable memory usage; monoliths tolerate larger heaps.
