When it comes to Java performance tuning, few topics generate as much confusion as the JVM and Garbage Collection (GC). Developers often inherit half-truths from outdated blog posts, legacy system war stories, or misunderstood documentation.
This tutorial debunks the most common myths about the JVM and GC, providing evidence-backed insights to help you tune modern Java applications effectively.
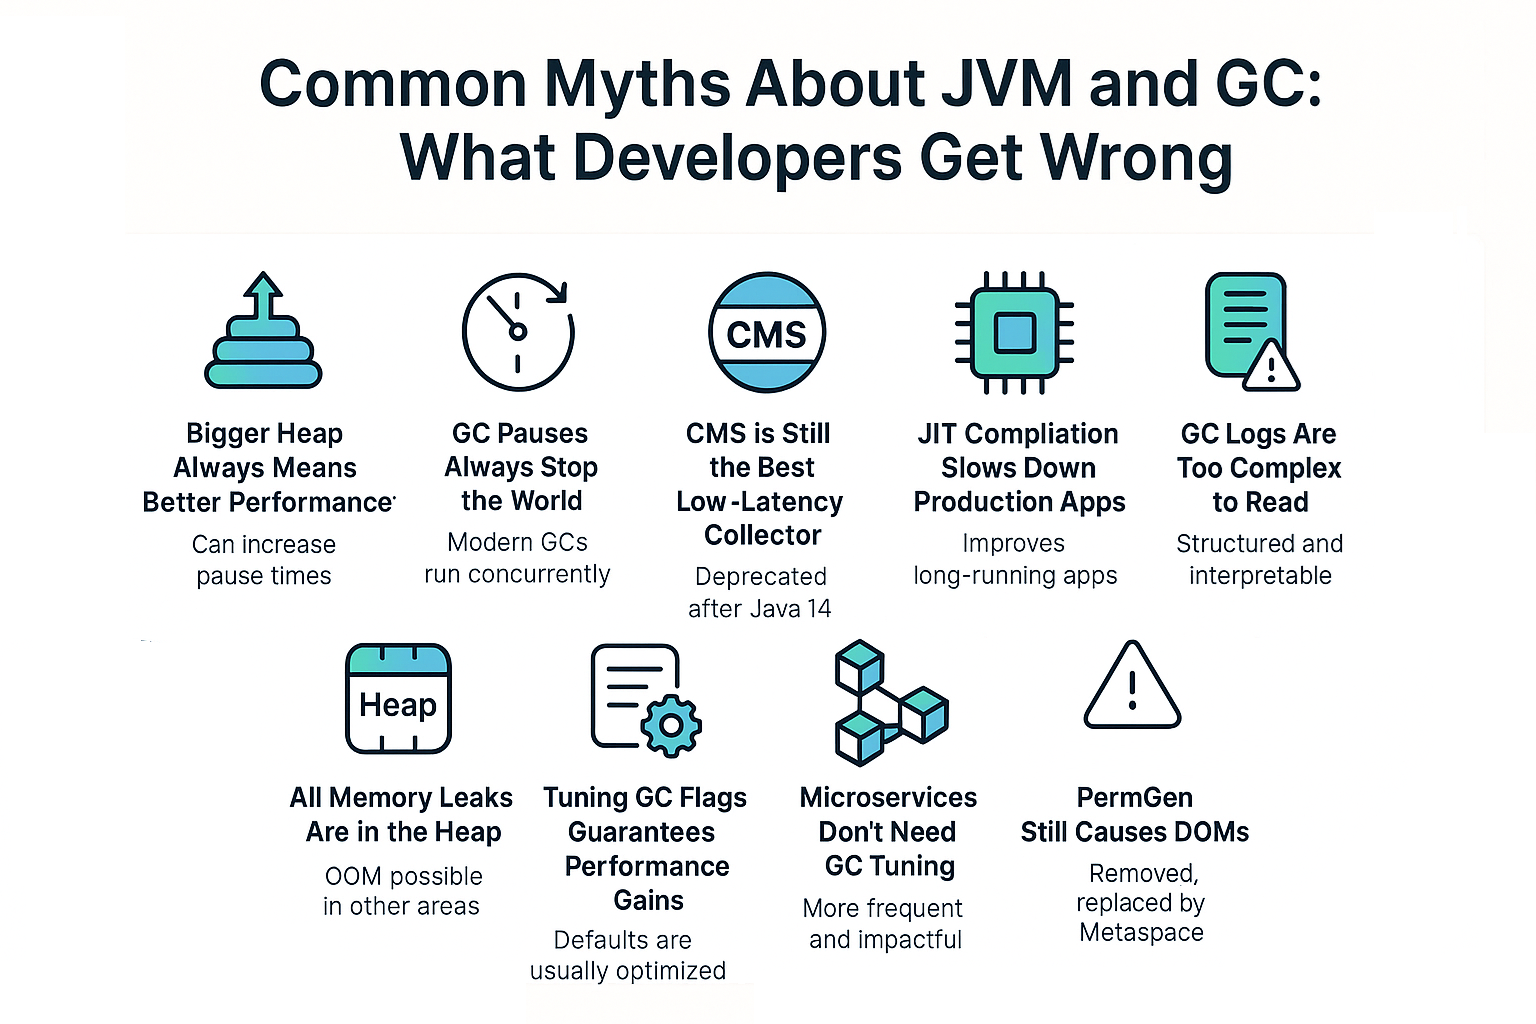
Myth 1: “Bigger Heap Always Means Better Performance”
Reality:
A larger heap can reduce GC frequency but increase pause times.
- Small heaps → frequent GCs but shorter pauses.
- Large heaps → infrequent GCs but longer pauses.
Best Practice: Size the heap based on workload patterns, not blindly maxing out available RAM.
Myth 2: “GC Pauses Always Stop the World”
Reality:
Modern GCs like G1, ZGC, and Shenandoah perform concurrent marking and compaction, reducing stop-the-world pauses to milliseconds.
- Old GCs (Serial, Parallel) had longer global pauses.
- New GCs focus on predictable latency.
Myth 3: “CMS is Still the Best Low-Latency Collector”
Reality:
CMS was deprecated and removed after Java 14.
- Replacements: G1 (default), ZGC, Shenandoah.
- These collectors offer better predictability and scalability than CMS.
Myth 4: “JIT Compilation Slows Down Production Apps”
Reality:
The JIT compiles only hot methods, applying advanced optimizations like inlining and escape analysis. It improves long-running apps.
- Startup can be slower, but tiered compilation (C1 + C2) balances startup and throughput.
- For short-lived workloads, use GraalVM Native Image.
Myth 5: “GC Logs Are Too Complex to Read”
Reality:
While verbose, GC logs are structured and interpretable with the right tools.
- Use flags:
-Xlog:gc*:file=gc.log:time,uptime,level,tags
- Tools: GCViewer, GCEasy, Mission Control.
Myth 6: “Safepoints Only Happen During GC”
Reality:
Safepoints also occur for JIT deoptimizations, biased lock revocations, and thread stack walks. Overhead depends on frequency, not just GC.
Myth 7: “All Memory Leaks Are in the Heap”
Reality:
OOM can occur in Metaspace, Direct Buffers, or Threads. Heap leaks are common but not the only culprit.
- Use
-XX:+HeapDumpOnOutOfMemoryErrorfor diagnosis.
Myth 8: “Tuning GC Flags Guarantees Performance Gains”
Reality:
Over-tuning without benchmarks can hurt performance. Defaults in Java 11+ are optimized for most workloads.
Best Practice: Tune only after observing real-world metrics.
Myth 9: “Microservices Don’t Need GC Tuning”
Reality:
Microservices often run with small heaps, making GC more frequent and impactful. Tuning is often more critical than in monoliths.
Myth 10: “PermGen Still Causes OOMs”
Reality:
PermGen was removed in Java 8, replaced by Metaspace. If you see PermGen OOMs, you’re running outdated Java versions.
Case Study: Banking Microservice
- Developers increased heap size from 2GB to 8GB expecting fewer GCs.
- Result: Pauses increased from 100ms → 1s.
- Fix: Right-sized heap at 4GB, switched to G1 GC, tuned pause targets with
-XX:MaxGCPauseMillis=200.
JVM Version Tracker
- Java 8: G1 optional, CMS popular.
- Java 11: G1 default, ZGC introduced.
- Java 17: ZGC & Shenandoah production-ready.
- Java 21+: NUMA-aware GC, Lilliput small object headers.
Conclusion & Key Takeaways
- JVM and GC myths persist because of outdated knowledge.
- Modern collectors (G1, ZGC, Shenandoah) make latency predictable.
- Heap size and flags must be tuned with metrics-driven benchmarks.
- Always test tuning changes under production-like load.
FAQ
1. What is the JVM memory model and why does it matter?
It defines visibility and ordering rules for threads, impacting GC efficiency.
2. How does G1 GC differ from CMS?
G1 uses region-based compaction; CMS suffered from fragmentation.
3. When should I use ZGC or Shenandoah?
For apps with strict latency requirements (<10ms pauses).
4. What are JVM safepoints and why do they matter?
Safepoints pause threads for GC, JIT, or class redefinition; tuning reduces their frequency.
5. How do I solve OutOfMemoryError in production?
Collect heap dumps, analyze with MAT/VisualVM, fix leaks, and resize memory.
6. What are the trade-offs of throughput vs latency tuning?
Throughput favors batch jobs; latency tuning ensures responsive APIs.
7. How do I read and interpret GC logs?
Look at pause times, allocation rates, and promotion failures.
8. How does JIT compilation optimize performance?
By inlining, eliminating redundant allocations, and reducing method dispatch cost.
9. What’s the future of GC in Java (Project Lilliput)?
Reduced object headers, improved memory efficiency, and faster GC.
10. How does GC differ in microservices/cloud vs monoliths?
Microservices need smaller, tuned heaps for predictable latency; monoliths prioritize throughput.
