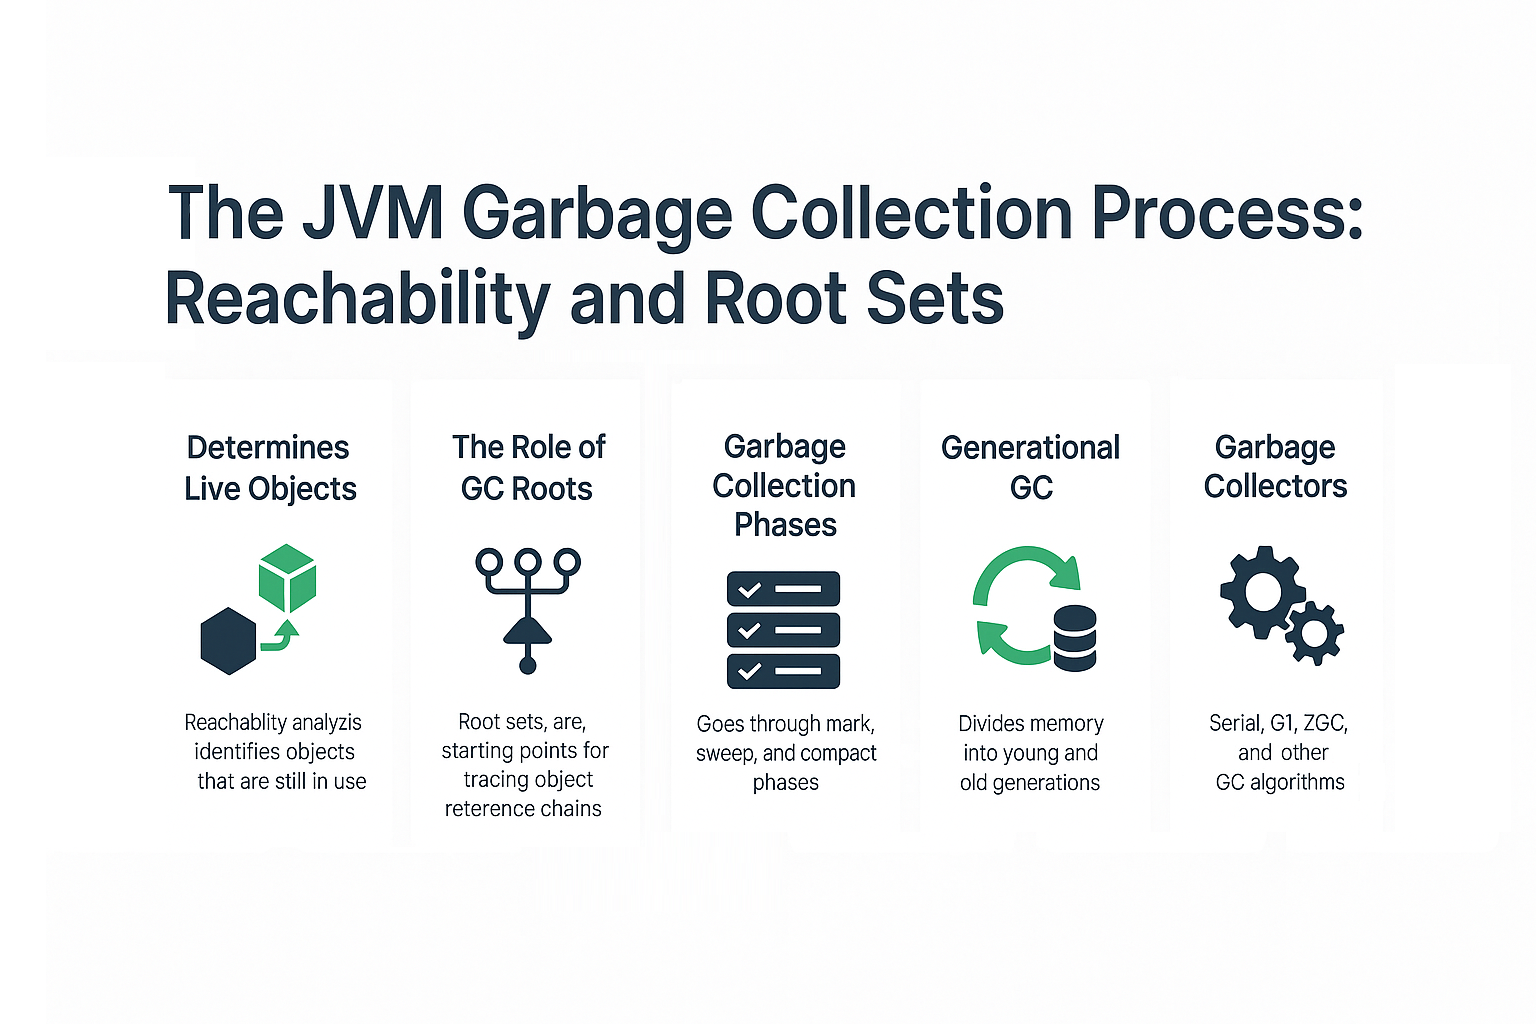
One of the most critical features of the Java Virtual Machine (JVM) is Garbage Collection (GC), which frees developers from manual memory management. At the core of this process is reachability analysis—a method used by the JVM to decide which objects are alive and which are garbage. This analysis starts with root sets, a collection of references that act as entry points for tracing object graphs.
In this tutorial, we’ll break down how reachability and root sets drive garbage collection in the JVM.
Why Reachability and Root Sets Matter
- Ensures safe memory reclamation without manual freeing.
- Provides a deterministic way to identify live vs dead objects.
- Helps avoid dangling pointers and memory leaks.
- Crucial for understanding GC tuning and troubleshooting production memory issues.
Analogy: Imagine tracing family relationships. Starting from ancestors (root sets), you can reach descendants (objects). Any person with no connection to the family tree is forgotten—just like garbage.
The Basics of Reachability Analysis
The JVM determines object liveness using reachability analysis:
- GC Roots → Starting points.
- Reachable Objects → Traced recursively from roots.
- Unreachable Objects → Not referenced, eligible for GC.
Unlike reference counting (used in older languages), reachability avoids cyclic reference issues.
What Are Root Sets in JVM?
Root sets (GC roots) are special references that are always considered reachable. They serve as the starting point for GC graph traversal.
Types of GC Roots
-
Local Variables in Stack Frames
- References inside methods and thread stacks.
-
Static Variables
- Class-level fields loaded by the classloader.
-
Active Threads
- Thread objects themselves.
-
JNI References
- Objects referenced by native code.
Example: Reachability in Action
public class GCDemo {
    static Object staticRef;

    public static void main(String[] args) {
        Object local = new Object(); // GC root: stack reference
        staticRef = new Object();    // GC root: static reference
        Object orphan = new Object();
        orphan = null;               // unreachable, eligible for GC

        System.gc(); // Suggest GC
    }
}
local→ Reachable via stack frame.staticRef→ Reachable via classloader.orphan→ Unreachable → GC candidate.
Garbage Collection Phases
- Mark Phase → Traverse object graph from GC roots, mark reachable objects.
- Sweep Phase → Collect and reclaim unreachable objects.
- Compact Phase → Rearrange live objects to reduce fragmentation (in some collectors).
Generational GC and Reachability
- Young Generation (Eden + Survivor spaces) → Frequent Minor GCs.
- Old Generation → Full GCs, triggered when memory fills.
- Metaspace → Stores class metadata, unloaded when classes are no longer referenced.
Reachability determines survival and promotion between generations.
Garbage Collectors and Reachability
- Serial & Parallel GC → Simple mark-sweep-compact.
- CMS → Concurrent marking, deprecated after Java 14.
- G1 GC → Region-based, traces reachability across regions.
- ZGC & Shenandoah → Concurrent collectors with near-pause-less execution.
GC Tuning Flags for Reachability
-XX:+PrintGCDetails→ Logs GC activity.-XX:+PrintGCApplicationStoppedTime→ Logs pause times.-XX:+PrintGCDateStamps→ Timestamps for GC logs.-Xms<size>/-Xmx<size>→ Control heap size.
Pitfalls and Troubleshooting
- Memory leaks → Objects remain reachable due to unintended references.
- Stop-the-world pauses → GC roots traversal halts all threads.
- High allocation rates → Frequent GCs and reduced throughput.
- Classloader leaks → Static references preventing class unloading.
Real-World Case Study
A web application hosted in Tomcat experienced OutOfMemoryError: Metaspace. Investigation revealed that classloaders were holding strong references to unused classes. By fixing classloader leaks, GC could reclaim unreachable classes, stabilizing memory usage.
Monitoring and Tools
- Java Flight Recorder (JFR) → Track GC roots and pauses.
- Java Mission Control (JMC) → Visualize memory graphs.
- VisualVM → Heap dumps for reachability analysis.
- Eclipse MAT → Detect memory leaks and GC root paths.
JVM Version Tracker
- Java 8 → G1 GC introduced as optional.
- Java 9 → G1 became default.
- Java 11 → ZGC added, experimental.
- Java 17 → ZGC & Shenandoah stable.
- Java 21+ → NUMA-aware GC and Lilliput optimizations improve memory footprint.
Best Practices
- Avoid long-lived static references unless necessary.
- Use weak references for caches to allow GC collection.
- Profile heap regularly in production.
- Choose GC algorithm based on application latency/throughput needs.
- Monitor GC root paths for memory leaks.
Conclusion & Key Takeaways
- Reachability analysis is the backbone of JVM garbage collection.
- GC roots act as entry points to determine live objects.
- Different collectors use reachability for marking, sweeping, and compaction.
- Monitoring GC roots is essential for debugging memory leaks.
- Tuning heap sizes and GC algorithms improves stability in production.
FAQs
1. What is the JVM memory model and why does it matter?
It ensures threads interact safely with memory, avoiding race conditions.
2. How does G1 GC differ from CMS?
G1 uses region-based collection with predictable pauses, while CMS had fragmentation issues.
3. When should I use ZGC or Shenandoah?
When applications demand ultra-low pause times with large heaps.
4. What are JVM safepoints?
Points where threads pause to allow GC or JIT optimizations.
5. How do I solve OutOfMemoryError in production?
Analyze heap dumps, fix leaks, tune GC flags, and scale heap size.
6. What are the trade-offs of throughput vs latency in GC?
Throughput favors max work done; latency favors short response times.
7. How do I read and interpret GC logs?
Enable GC logging and use GCViewer or JMC for analysis.
8. How does JIT affect GC?
JIT reduces allocations through inlining and escape analysis, lowering GC frequency.
9. What’s new in Java 21 GC?
NUMA-aware GC and Project Lilliput reduce memory footprint and pause times.
10. How does GC differ in microservices vs monoliths?
Microservices need quick startup and predictable latency, while monoliths often tune for throughput.
