The HotSpot JVM continuously optimizes running Java code through Just-In-Time (JIT) compilation. But not all optimizations are permanent—sometimes the JVM must roll them back, a process known as deoptimization.
Deoptimization ensures correctness when assumptions made by the JIT compiler no longer hold true. While it introduces overhead, it is a cornerstone of the JVM’s adaptive execution model. This tutorial explains what deoptimization is, why it happens, how it impacts performance, and how to monitor it.
What is Deoptimization?
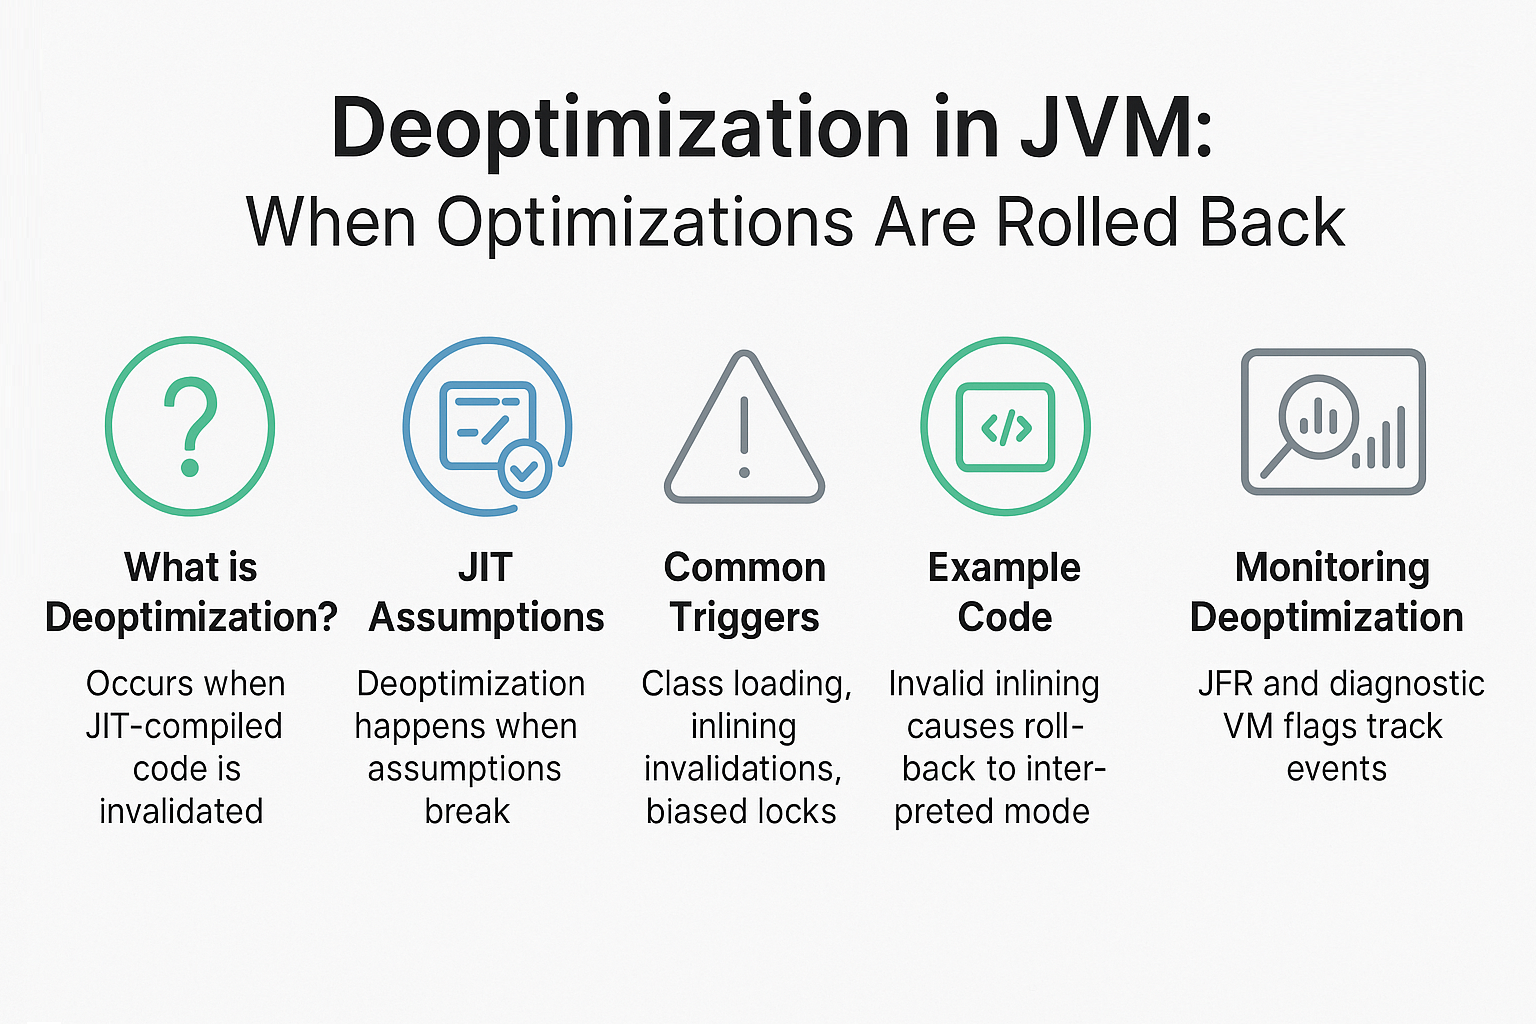
- Definition: Deoptimization occurs when the JVM discards previously compiled native code and reverts execution back to the interpreter.
- Purpose: To ensure correctness when JIT optimizations become invalid.
- Mechanism: JVM maintains metadata (“debug info”) to reconstruct interpreter state from optimized code.
Why Does Deoptimization Happen?
JIT optimizations rely on assumptions about code execution. If those assumptions are invalidated, deoptimization occurs.
Common Triggers
- Class Loading: New classes change method resolution assumptions.
- Inlining Invalidations: A method inlined by JIT is overridden dynamically.
- Speculative Optimizations: Assumptions about branch prediction fail.
- Biased Lock Revocation: Safepoint revokes a lock bias, forcing deoptimization.
- Profile Changes: Runtime profiling changes (hot/cold paths).
Example of Deoptimization
class Animal {
    void speak() { System.out.println("Animal"); }
}

class Dog extends Animal {
    @Override
    void speak() { System.out.println("Dog"); }
}

public class DeoptExample {
    public static void main(String[] args) {
        Animal a = new Animal();
        for (int i = 0; i < 1_000_000; i++) {
            a.speak();
        }
        a = new Dog(); // Causes deoptimization when JIT assumptions break
        a.speak();
    }
}
- JVM may inline
Animal.speak()assuming no overrides. - When
Dog.speak()is called, assumption breaks → deoptimization.
Safepoints and Deoptimization
- Deoptimization requires all threads to reach a safepoint.
- Ensures consistent state before replacing compiled code with interpreter frames.
- Introduces a pause proportional to thread response.
Monitoring Deoptimization
JVM Flags
-XX:+UnlockDiagnosticVMOptions -XX:+PrintDeoptimization
-XX:+UnlockDiagnosticVMOptions -XX:+PrintCompilation
Using JFR + Mission Control
- Track deoptimization events.
- Analyze causes (inlining, class loading, lock revocation).
- Correlate with GC pauses and safepoints.
Real-World Case Studies
Case 1: Microservices Latency Spikes
- Issue: Latency spikes under traffic surge.
- Diagnosis: Frequent deoptimizations due to dynamic proxies.
- Solution: Replaced proxies with generated bytecode.
- Result: Reduced deoptimization frequency, stable latency.
Case 2: Trading Engine
- Issue: GC pauses + safepoints aligned with deoptimizations.
- Diagnosis: Biased lock revocation caused deopt.
- Solution: Disabled biased locking.
- Result: Latency consistency improved.
Pitfalls and Troubleshooting
- Frequent Deoptimizations: Indicate unstable profiling or dynamic class loading.
- Latency Spikes: Safepoints during deoptimization may cause jitter.
- Hard to Debug: Need JFR or diagnostic flags for visibility.
- Framework Effects: Dynamic frameworks (Hibernate, Spring) trigger deopts often.
Best Practices
- Profile deoptimizations in staging with JFR.
- Use stable method dispatch (avoid excessive dynamic proxies).
- Disable biased locking if latency-sensitive.
- Keep JVM updated—modern versions reduce unnecessary deoptimizations.
- Benchmark changes across workloads before rollout.
JVM Version Tracker
- Java 8: Frequent deoptimizations due to biased locking, dynamic proxies.
- Java 11: G1 default, better JIT heuristics.
- Java 17: Stable ZGC/Shenandoah, fewer deopts under load.
- Java 21+: Project Lilliput improves lock revocation + JIT adaptability.
Conclusion & Key Takeaways
- Deoptimization is not a bug—it’s a feature ensuring JVM correctness.
- Triggered when JIT assumptions fail (class loading, inlining, locks).
- Introduces overhead but enables adaptive optimization.
- Monitoring and minimizing deopts is key for low-latency systems.
FAQ
1. What is the JVM memory model and why does it matter?
It ensures correctness across threads when switching between compiled and interpreted code.
2. How does G1 GC differ from CMS?
G1 compacts memory regions, CMS fragmented old gen.
3. When should I use ZGC or Shenandoah?
For ultra-low-latency workloads sensitive to safepoint pauses.
4. What are JVM safepoints and why do they matter?
Required for deoptimization, ensuring a consistent state before rollback.
5. How do I solve OutOfMemoryError in production?
Check GC logs, tune heap, fix leaks, and verify deopt frequency.
6. What are the trade-offs of throughput vs latency tuning?
Throughput may tolerate more deopts; latency-sensitive apps cannot.
7. How do I read and interpret GC logs?
Check pause times and correlate with safepoint/deopt logs.
8. How does JIT compilation optimize performance?
Inlining, escape analysis, speculative optimizations—all may trigger deopts if invalidated.
9. What’s the future of GC in Java (Project Lilliput)?
Smaller headers reduce lock/deopt overhead, improving GC/JIT interactions.
10. How does GC differ in microservices vs monoliths?
Microservices emphasize predictable latency; deopts and safepoints must be minimized.
