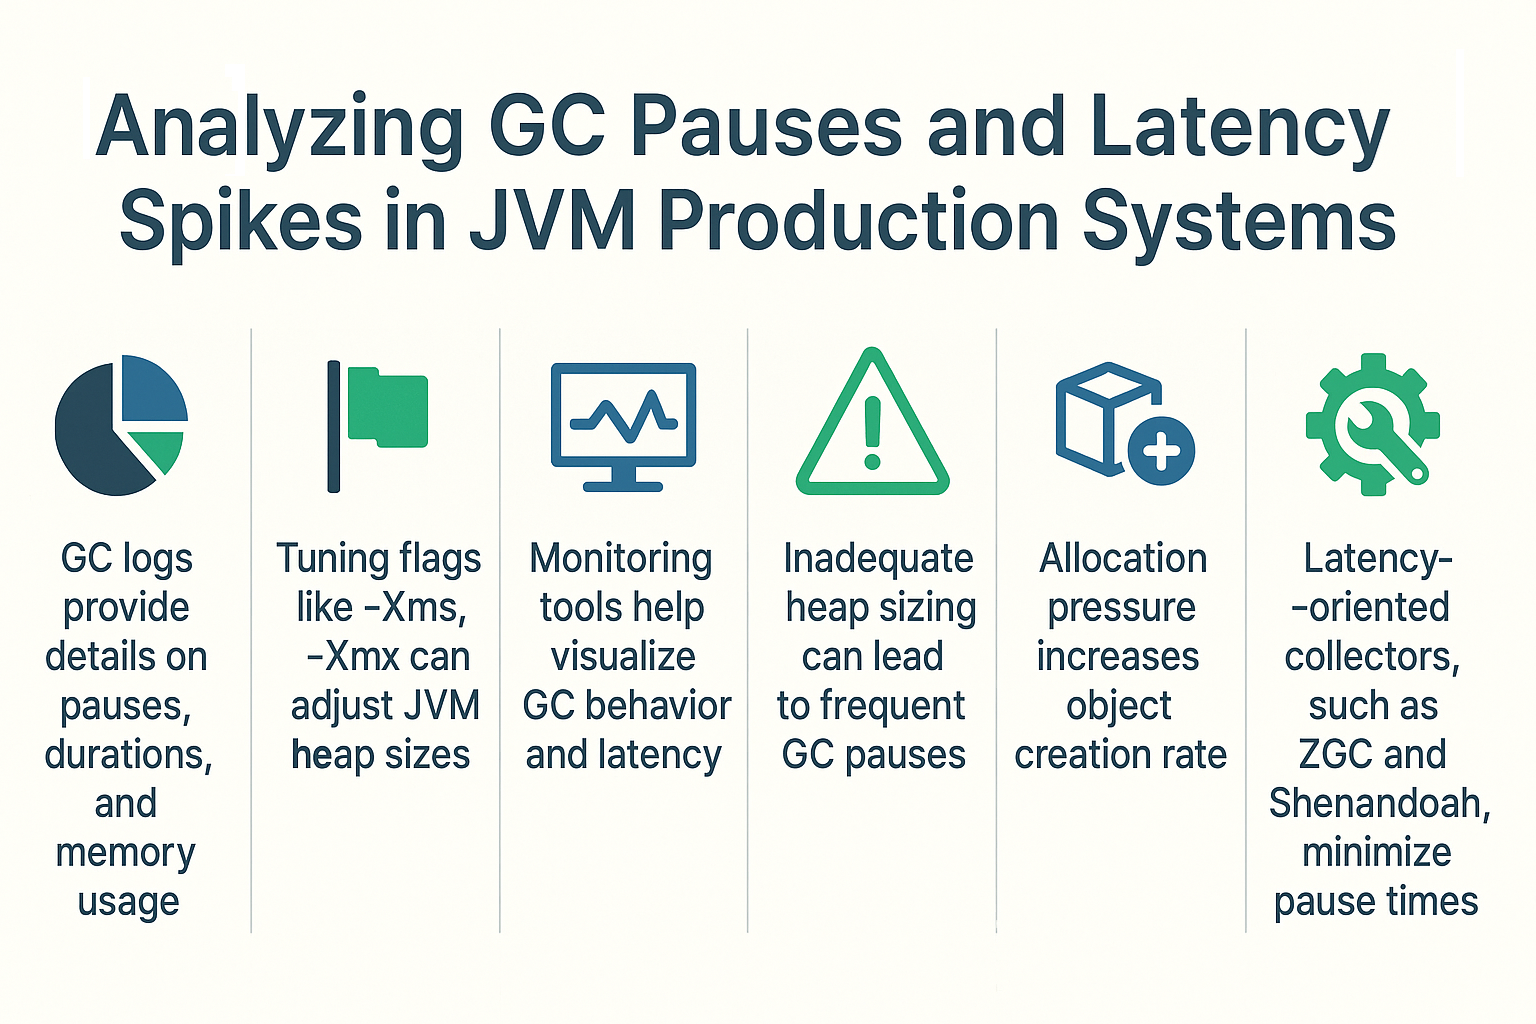
A Java application running smoothly in development may suddenly experience latency spikes and unpredictable pauses in production. Most often, the culprit is the Garbage Collector (GC).
While GC is essential for automatic memory management, poorly tuned collectors, inappropriate heap sizing, or unexpected allocation patterns can cause multi-second pauses. In latency-sensitive systems—like trading apps, gaming servers, or microservices—these pauses translate into lost revenue, poor user experience, and breached SLAs.
This tutorial provides a deep dive into analyzing GC pauses and latency spikes in production, equipping you with the tools, techniques, and strategies to identify and fix the root cause.
What Are GC Pauses?
GC pauses occur when the JVM temporarily stops application threads (Stop-the-World events) to perform garbage collection tasks such as marking, sweeping, or compacting memory.
Causes of Pauses
- Minor GC: Frequent young-gen collections. Usually short (<10ms) but can add up.
- Major GC / Full GC: Old-gen collection, potentially seconds-long.
- Compaction: Rearranging objects to avoid fragmentation.
- Safepoints: Required for consistent memory state during GC.
Throughput vs Latency in GC Behavior
- Throughput-oriented collectors (Parallel GC): Fewer but longer pauses.
- Latency-oriented collectors (ZGC, Shenandoah): Many short pauses, more predictable response times.
- Balanced collectors (G1 GC): Trade-off between pause predictability and throughput.
Choosing the wrong collector for your workload is one of the most common reasons for latency spikes.
Tools for Analyzing GC Pauses in Production
GC Logs
- Java 8:
-XX:+PrintGCDetails -XX:+PrintGCDateStamps -Xloggc:gc.log - Java 9+:
-Xlog:gc*:file=gc.log:time,uptime,level,tags
VisualVM
- Heap usage graphs and pause time visualization.
- Trigger manual GC for testing.
JConsole
- Simple monitoring of heap and GC counts.
- Lightweight for quick diagnostics.
Java Mission Control (JMC) + JFR
- Low-overhead continuous profiling.
- Pinpoints allocation hotspots and pause-time causes.
Example: Reading GC Logs
[12.345s][info][gc] GC(4) Pause Young (G1 Evacuation Pause) 120M->40M(256M) 20.456ms
Interpretation:
- Pause Young (G1 Evacuation Pause): Minor GC event.
- 120M->40M(256M): Heap before, after, and total size.
- 20.456ms: Pause duration (acceptable in most systems).
Common Causes of Latency Spikes
1. Inadequate Heap Sizing
- Heap too small → frequent collections.
- Heap too large → long GC pauses.
- Fix: Tune
-Xms,-Xmx.
2. Allocation Pressure
- Excessive short-lived objects.
- Fix: Optimize code, object pooling, use primitive collections.
3. Old Generation Pressure
- Long-lived objects retained.
- Fix: Analyze references, adjust survivor ratios.
4. Fragmentation (CMS)
- Old issue with Concurrent Mark-Sweep (CMS).
- Fix: Use G1, ZGC, or Shenandoah.
5. Container Limits
- JVM unaware of cgroup limits → OOMKilled in Docker/K8s.
- Fix: Use
-XX:+UseContainerSupport.
Case Studies
Case 1: Latency Spikes in Microservices
- Issue: 500ms pauses in REST API.
- Diagnosis: GC logs showed frequent Full GCs due to small heap.
- Solution: Increased
-Xmx, switched to G1 GC. - Result: Pauses reduced to <50ms.
Case 2: Trading App with Strict SLAs
- Issue: 2s pause during high-volume trading.
- Diagnosis: Allocation spike caused old-gen promotion.
- Solution: Migrated from G1 to ZGC.
- Result: Pauses consistently <5ms.
Case 3: Kubernetes Deployment
- Issue: JVM killed by OOM in container.
- Diagnosis: JVM ignored cgroup limits.
- Solution: Enabled container support flags.
- Result: Stable memory usage, no more OOM kills.
Best Practices for Preventing Latency Spikes
- Always enable GC logging in production.
- Use JFR + Mission Control for profiling.
- Tune heap size based on real-world load, not guesswork.
- Avoid over-tuning—start with defaults.
- Match collector to workload: G1 for general apps, ZGC/Shenandoah for low-latency, Parallel for batch.
- Test tuning in staging under production-like traffic.
JVM Version Tracker
- Java 8: Parallel GC default, CMS optional.
- Java 11: G1 default.
- Java 17: ZGC and Shenandoah stable.
- Java 21+: NUMA-aware, Project Lilliput optimizations for smaller object headers.
Conclusion & Key Takeaways
GC pauses are inevitable, but unpredictable latency spikes are preventable.
- Monitor with GC logs, JVisualVM, JConsole, and JFR.
- Size heaps correctly and set realistic pause time goals.
- Match collector to workload type.
- Always validate tuning in production-like environments.
By analyzing GC pauses effectively, you can achieve predictable latency, stable throughput, and reliable production performance.
FAQ
1. What is the JVM memory model and why does it matter?
It defines how memory regions interact with threads; GC correctness depends on it.
2. How does G1 GC differ from CMS?
G1 is region-based with compaction, CMS had fragmentation issues.
3. When should I use ZGC or Shenandoah?
For ultra-low latency workloads with strict SLAs.
4. What are JVM safepoints and why do they matter?
Points where all threads pause for GC and JIT to work safely.
5. How do I solve OutOfMemoryError in production?
Check GC logs, heap dumps, tune -Xmx, fix leaks.
6. What are the trade-offs of throughput vs latency tuning?
Throughput favors efficiency, latency favors responsiveness.
7. How do I read and interpret GC logs?
Look for heap before/after sizes, pause times, and GC type.
8. How does JIT compilation optimize performance?
Compiles hot code at runtime, reducing interpretation overhead.
9. What’s the future of GC in Java (Project Lilliput)?
Smaller object headers reduce memory footprint and improve efficiency.
10. How does GC differ in microservices vs monoliths?
Microservices emphasize predictable latency; monoliths may prioritize throughput.
