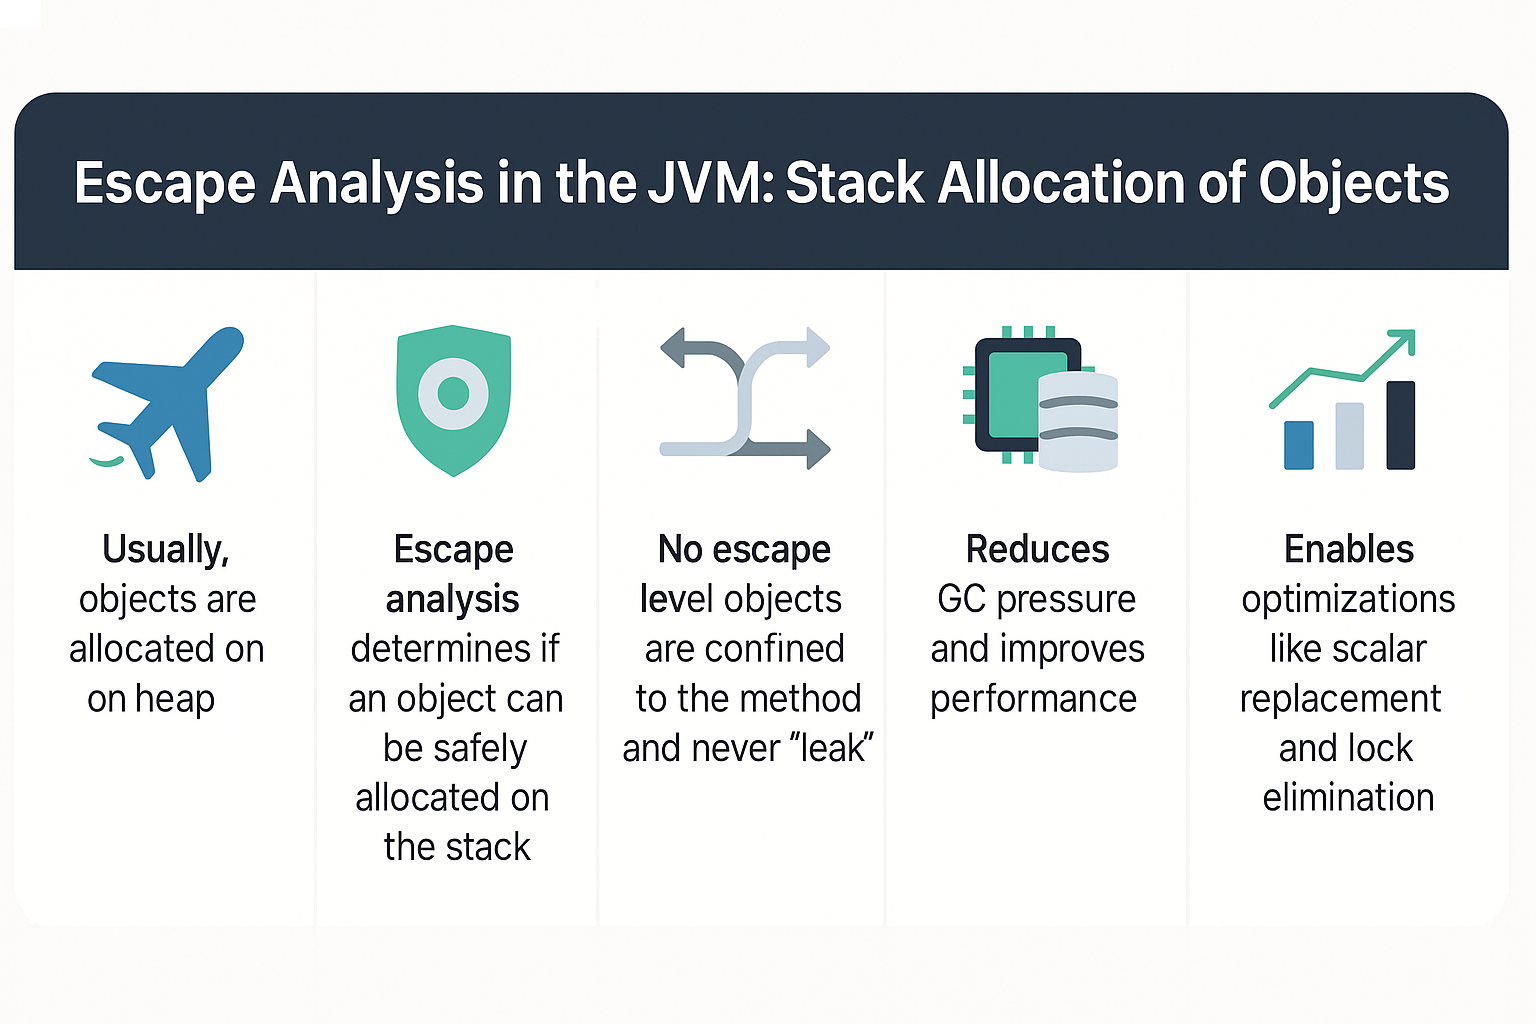
When you create an object in Java, it usually lives on the heap, managed by the Garbage Collector (GC). But not all objects need to stay there. If the JVM can prove that an object does not “escape” the scope of a method or thread, it can allocate that object on the stack instead. This optimization is called escape analysis.
In this tutorial, we’ll explore what escape analysis is, how it works inside the JVM, and why it’s a game-changer for performance-sensitive applications.
Why Escape Analysis Matters
- Reduces GC pressure by keeping short-lived objects off the heap.
- Improves cache locality and execution speed.
- Helps in low-latency and high-throughput systems.
- Makes object creation almost as cheap as primitive allocation.
Analogy: Imagine using disposable paper for quick notes instead of storing everything in a permanent file cabinet. Escape analysis lets the JVM decide which notes can be safely discarded after use.
What is Escape Analysis?
Escape analysis is a technique performed by the JIT compiler to determine whether an object can be safely allocated on the stack instead of the heap.
Levels of Escape
- No Escape → Object is confined within the method and never leaks.
- Method Escape → Object escapes the method but not the thread.
- Thread Escape → Object is shared across threads.
Only no escape objects are eligible for stack allocation.
Example Without Escape Analysis
public class WithoutEscape {
    static class Point {
        int x, y;
    }

    public Point createPoint() {
        return new Point(); // Escapes to the heap
    }
}
Here, Point escapes the method because it is returned, so it must live on the heap.
Example With Escape Analysis
public class WithEscape {
    static class Point {
        int x, y;
    }

    public int sum() {
        Point p = new Point(); // Does not escape
        p.x = 10;
        p.y = 20;
        return p.x + p.y;
    }
}
In this case, the JVM detects that Point never escapes the method. The object can be allocated on the stack, avoiding heap allocation and GC overhead.
Escape Analysis and JIT Optimizations
Escape analysis enables several powerful optimizations:
1. Stack Allocation
- Objects that don’t escape can be placed on the stack.
- Eliminates GC responsibility for them.
2. Scalar Replacement
- Object fields can be replaced with local variables.
- Example: Instead of allocating a
Pointobject, just allocate twoints (x,y).
3. Synchronization Elimination
- If a lock object never escapes, synchronization can be removed.
- JVM optimizes away unnecessary
synchronizedblocks.
Garbage Collection Benefits
- Fewer heap allocations → reduced GC frequency.
- Smaller young generation pressure → faster minor GCs.
- Improved throughput for allocation-heavy applications.
JVM Flags for Escape Analysis
-XX:+DoEscapeAnalysis→ Enables escape analysis (default in HotSpot).-XX:+PrintEscapeAnalysis→ Debug information.-XX:+EliminateAllocations→ Enables scalar replacement.-XX:+EliminateLocks→ Enables lock elimination.
Pitfalls and Limitations
- Escape analysis works only when JIT runs (not during interpretation).
- Aggressive optimizations may be rolled back if profiling changes.
- Objects passed to other threads cannot benefit.
- Sometimes, stack allocation is skipped due to complex analysis.
Real-World Case Study
In high-frequency trading systems, developers reported significant performance gains when using JVM escape analysis. By avoiding millions of unnecessary heap allocations per second, they reduced GC pauses and achieved microsecond-level latencies.
Monitoring and Tools
- JFR (Java Flight Recorder) → Check allocation profiling.
- JMC (Java Mission Control) → Inspect heap allocations.
- JITWatch → Visualize JIT optimizations like escape analysis.
JVM Version Tracker
- Java 8 → Escape analysis fully enabled by default.
- Java 11 → Improved scalar replacement.
- Java 17 → Optimized synchronization elimination.
- Java 21+ → Project Lilliput further reduces object header size, improving stack allocation efficiency.
Best Practices
- Design methods to minimize object escapes.
- Prefer local object usage when possible.
- Use immutable objects for safe optimizations.
- Monitor allocations before tuning flags.
- Don’t prematurely optimize—rely on JIT and profiling.
Conclusion & Key Takeaways
- Escape analysis allows the JVM to allocate some objects on the stack instead of the heap.
- It reduces GC pressure, improves speed, and enables scalar replacement.
- JIT optimizations like lock elimination are powered by escape analysis.
- Real-world systems benefit from reduced latency and improved throughput.
FAQs
1. What is the JVM memory model and why does it matter?
It defines how threads interact with memory safely and consistently.
2. How does G1 GC differ from CMS?
G1 avoids fragmentation with region-based collection, while CMS suffered from compaction issues.
3. When should I use ZGC or Shenandoah?
When applications demand low pause times and high responsiveness.
4. What are JVM safepoints?
Moments when all threads pause so JVM can perform GC or JIT deoptimizations.
5. How do I solve OutOfMemoryError in production?
Increase heap, tune GC flags, and use profiling tools to find leaks.
6. How does escape analysis reduce GC pressure?
By moving short-lived allocations to the stack, bypassing the heap entirely.
7. What is scalar replacement?
Replacing object fields with individual variables to avoid allocations.
8. How do I monitor if escape analysis is working?
Enable -XX:+PrintEscapeAnalysis or use JITWatch/JFR.
9. What’s new in Java 21 regarding memory optimization?
Project Lilliput improves object layout efficiency, benefiting stack allocation.
10. How does GC differ in microservices vs monoliths?
Microservices prioritize low latency and fast startup, while monoliths often tune for throughput.
