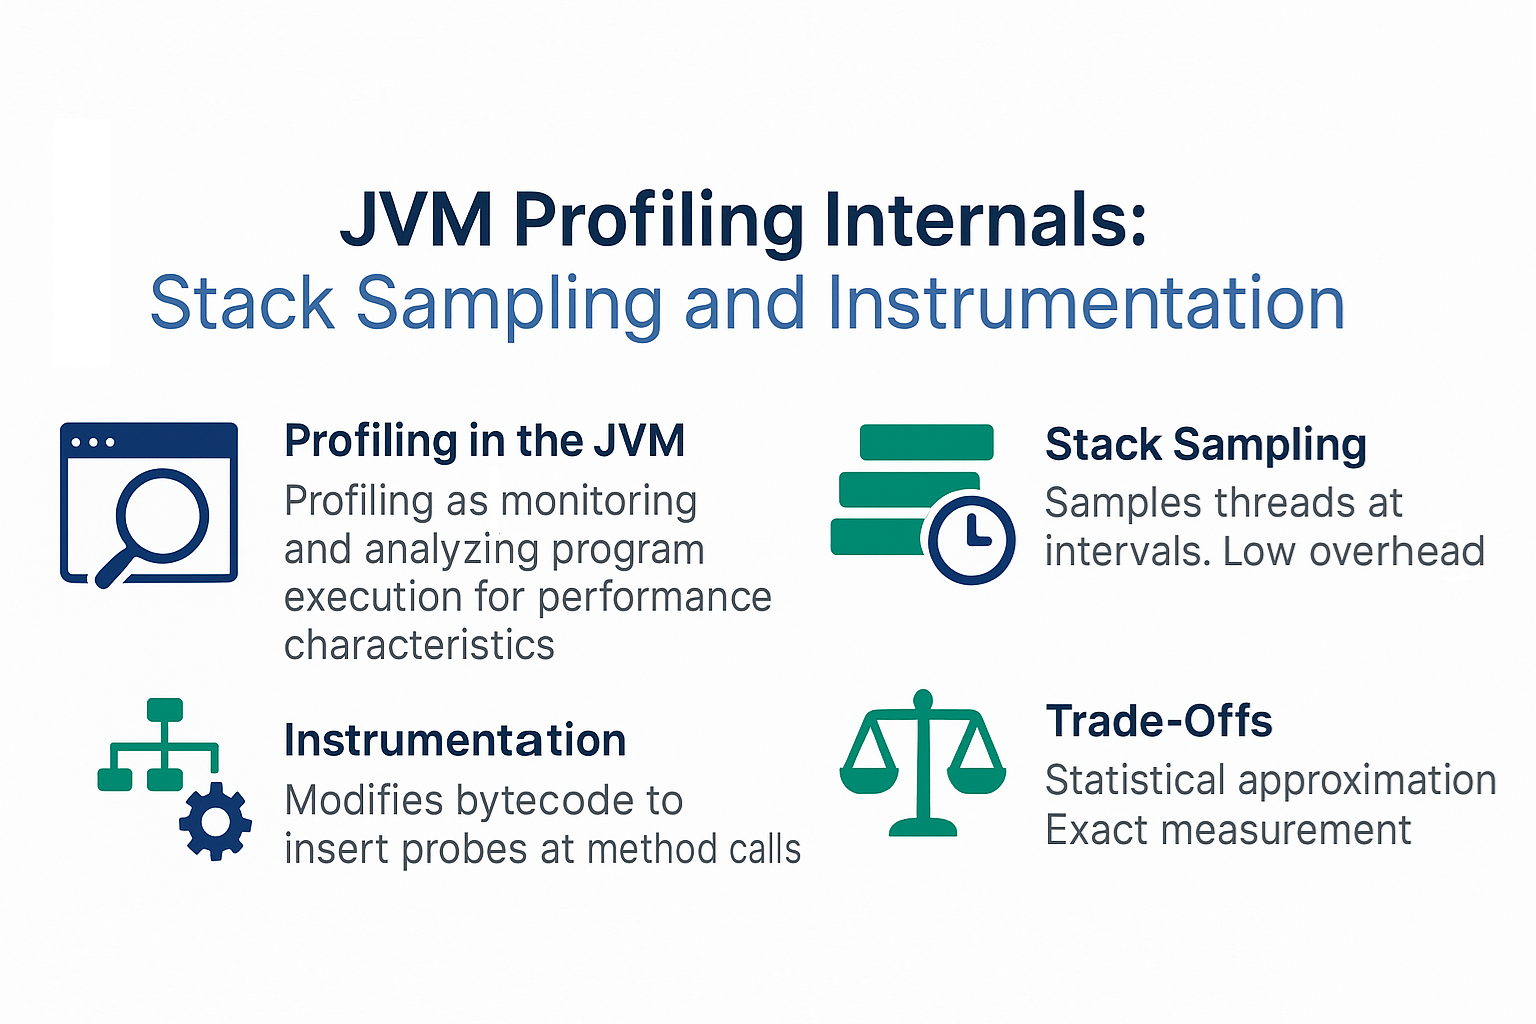
Profiling is one of the most powerful techniques for understanding the runtime behavior of Java applications. It allows developers to pinpoint bottlenecks, excessive allocations, and synchronization issues.
The JVM provides two major approaches to profiling: stack sampling and instrumentation. Both approaches enable deep visibility into execution internals, but they differ in accuracy, overhead, and use cases.
This tutorial explains JVM profiling internals, how stack sampling and instrumentation work, their trade-offs, and best practices for using them in real-world Java applications.
What is JVM Profiling?
- Definition: Profiling is the process of monitoring and analyzing a program’s execution to measure performance characteristics.
- Goal: Identify bottlenecks, optimize resource usage, and improve throughput or latency.
- Techniques:
- Stack Sampling (Statistical Profiling).
- Instrumentation (Bytecode Modification).
Stack Sampling in JVM
How It Works
- Periodically samples thread stacks at fixed intervals.
- Identifies methods where CPU time is spent most often.
- Lightweight and low-overhead, suitable for production.
Advantages
- Low performance impact.
- Useful for long-running applications.
- Detects hotspots over time.
Disadvantages
- Statistical approximation, not exact.
- May miss rare execution paths.
Example Tools
- Async Profiler
- Java Flight Recorder (JFR)
- VisualVM (sampling mode)
Instrumentation in JVM
How It Works
- Inserts probes into bytecode at method entry/exit or allocation points.
- Records precise timing and event details.
- High accuracy, but higher overhead.
Advantages
- Exact measurements of method execution time.
- Provides detailed insights into allocations, GC, and synchronization.
Disadvantages
- Higher overhead, not ideal for production.
- Can alter program timing (observer effect).
Example Tools
- JFR (instrumented events)
- Mission Control
- BTrace
- Custom Java Agents with
java.lang.instrument
Stack Sampling vs Instrumentation
| Feature | Stack Sampling | Instrumentation |
|---|---|---|
| Accuracy | Statistical estimate | Exact measurements |
| Overhead | Low (1–2%) | High (10–100%) |
| Use Case | Production monitoring | Development deep dive |
| Visibility | Hot methods only | Full method execution data |
Profiling and GC Analysis
Profiling also integrates with GC internals:
- Detects allocation hotspots that trigger frequent GC.
- Analyzes safepoints and their performance impact.
- Identifies memory leaks via object lifetime analysis.
Example JVM Flags
-XX:+UnlockCommercialFeatures -XX:+FlightRecorder
-XX:StartFlightRecording=duration=60s,filename=recording.jfr
Real-World Case Studies
Case 1: E-commerce Platform
- Issue: High CPU utilization under peak load.
- Diagnosis: Stack sampling revealed excessive JSON parsing.
- Solution: Replaced parser with optimized library.
- Result: 30% CPU reduction.
Case 2: Banking Application
- Issue: Latency spikes in transaction system.
- Diagnosis: Instrumentation showed excessive lock contention.
- Solution: Replaced synchronized blocks with
ReentrantLock. - Result: Latency reduced significantly.
Pitfalls and Troubleshooting
- Overhead from Instrumentation: Avoid in production unless necessary.
- Misinterpretation of Sampling Data: Statistical noise can mislead.
- Observer Effect: Instrumentation may alter program performance.
- Incomplete Data: Sampling may miss rare bottlenecks.
Best Practices
- Use stack sampling for production monitoring.
- Use instrumentation for development debugging.
- Combine sampling + instrumentation with JFR.
- Always correlate profiling data with GC and safepoint logs.
- Benchmark after optimizations to confirm improvement.
JVM Version Tracker
- Java 8: JFR available in commercial JDK.
- Java 11: JFR open-sourced and included in OpenJDK.
- Java 17: Async Profiler + JFR integrations widely adopted.
- Java 21+: Improved low-overhead profiling with better safepoint bias handling.
Conclusion & Key Takeaways
- Stack Sampling: Low overhead, statistical, production-friendly.
- Instrumentation: Precise but high overhead, best for dev/test.
- Profiling helps detect GC bottlenecks, allocation hotspots, and synchronization issues.
- Tools like JFR, Mission Control, Async Profiler, and JITWatch provide rich insights.
- Profiling is essential for optimizing modern Java applications.
FAQ
1. What is the JVM memory model and why does it matter?
It ensures visibility and correctness across threads when profiling method execution.
2. How does G1 GC differ from CMS?
G1 compacts regions, CMS caused fragmentation.
3. When should I use ZGC or Shenandoah?
For ultra-low-latency workloads requiring minimal safepoint pauses.
4. What are JVM safepoints and why do they matter?
Profilers align with safepoints to collect stack data consistently.
5. How do I solve OutOfMemoryError in production?
Use profiling + GC logs to detect memory leaks and allocation hotspots.
6. What are the trade-offs of throughput vs latency tuning?
Throughput maximizes efficiency; latency tuning reduces spikes.
7. How do I read and interpret GC logs?
Look at pause times, heap usage before/after, and safepoint frequency.
8. How does JIT compilation optimize performance?
It inlines and optimizes methods; profiling reveals inlining decisions.
9. What’s the future of GC in Java (Project Lilliput)?
Smaller headers and NUMA awareness improve profiling accuracy.
10. How does GC differ in microservices vs monoliths?
Microservices prioritize predictable latency, monoliths emphasize throughput.
