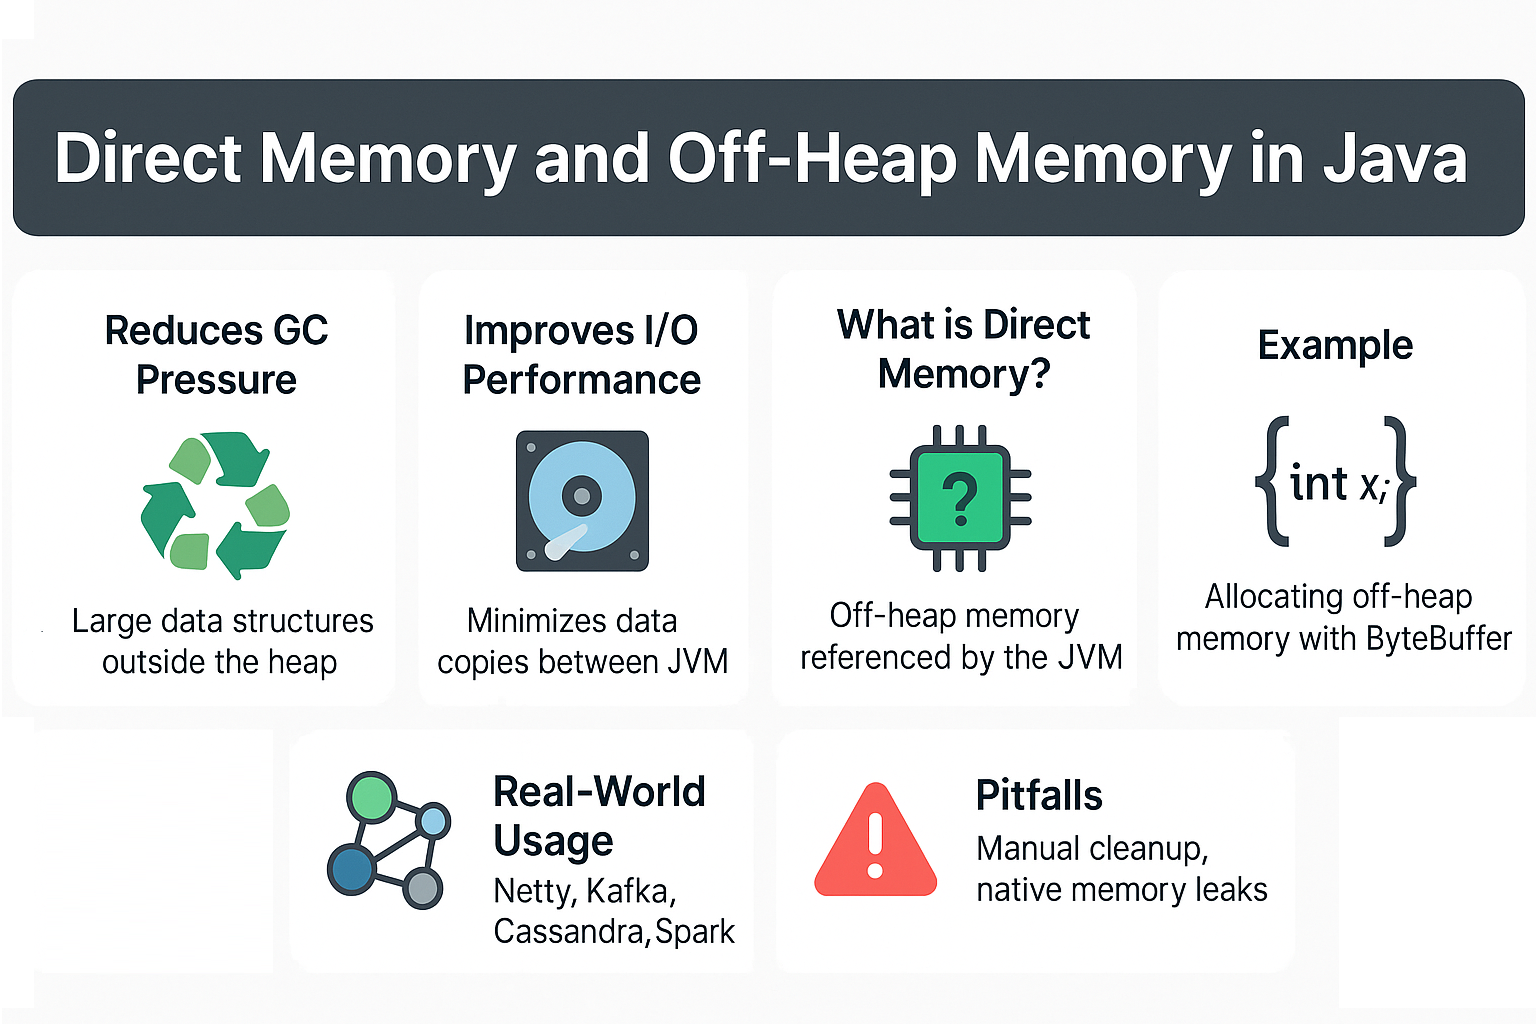
Java applications typically allocate objects on the heap, managed by the Garbage Collector (GC). However, for high-performance systems like databases, messaging systems, and big data frameworks, heap memory can become a bottleneck due to GC pauses. To address this, Java provides direct memory (off-heap memory), which is allocated outside the JVM heap but still accessible from Java code.
In this tutorial, we’ll explore what direct memory is, how it differs from heap memory, and when to use it for production applications.
Why Off-Heap Memory Matters
- Reduces GC pressure by keeping large data structures outside the heap.
- Improves I/O performance by minimizing data copies between JVM and OS.
- Useful for low-latency and high-throughput systems (e.g., Netty, Kafka, Cassandra).
- Provides fine-grained control over memory usage.
Analogy: Think of the JVM heap as a backpack. It’s handy but limited. Off-heap memory is like renting extra storage space outside the backpack—accessible but separate.
What is Direct Memory?
Direct memory is off-heap memory allocated directly from the operating system but referenced by the JVM. It is often accessed using java.nio.ByteBuffer.allocateDirect().
Characteristics
- Allocated outside the managed heap.
- Not directly controlled by GC.
- Must be explicitly released by the JVM when objects are garbage collected.
- Faster for I/O operations because data can be transferred directly to native buffers.
Heap vs Off-Heap Memory
| Feature | Heap Memory (On-Heap) | Direct Memory (Off-Heap) |
|---|---|---|
| Location | Managed inside JVM heap | Allocated in native memory |
| Managed by GC? | Yes | Indirectly (via references) |
| Performance | May suffer GC pauses | Faster for I/O operations |
| Usage | General object allocation | Large buffers, I/O, caching |
| Allocation | new keyword |
ByteBuffer.allocateDirect() |
Example: Using Direct Memory
import java.nio.ByteBuffer;

public class DirectMemoryExample {
    public static void main(String[] args) {
        // Allocate 1 MB off-heap memory
        ByteBuffer buffer = ByteBuffer.allocateDirect(1024 * 1024);

        // Write data
        for (int i = 0; i < 10; i++) {
            buffer.putInt(i);
        }

        buffer.flip();

        // Read data
        while (buffer.hasRemaining()) {
            System.out.println(buffer.getInt());
        }
    }
}
Here, memory is allocated outside the JVM heap, reducing GC overhead.
Direct Memory and GC
- Direct memory is not part of the Java heap.
- GC tracks only the reference (
ByteBufferobject). - The actual native memory is freed when the buffer object is garbage collected.
- If GC delays collection, native memory may remain allocated longer than expected.
Potential Error:
Exception in thread "main" java.lang.OutOfMemoryError: Direct buffer memory
JVM Tuning for Direct Memory
-XX:MaxDirectMemorySize=<size>→ Sets the maximum direct memory size.- If not specified, defaults to
-Xmx(maximum heap size). - Monitor usage with
jcmd VM.native_memoryor tools like JFR.
Real-World Usage
- Netty → Uses direct memory for network buffers.
- Apache Kafka → Relies on off-heap memory for message storage.
- Cassandra & Spark → Use direct memory for caching and big data processing.
Pitfalls of Off-Heap Memory
- Manual cleanup → May hold memory until GC collects the reference.
- Harder debugging → Native memory leaks are harder to track.
- Not portable → Behavior may vary across OS/JVM versions.
- Containerized environments → Docker memory limits may cause unexpected OOMs.
Garbage Collection and Direct Memory
- Heap GC does not clean up direct memory immediately.
- If applications allocate direct buffers aggressively, OOM errors may occur despite free heap space.
- Monitoring and explicit cleanup are essential for production use.
JVM Version Tracker
- Java 8 → Direct memory tuning via
-XX:MaxDirectMemorySize. - Java 11 → Improved native memory tracking.
- Java 17 → Integration with JFR for better monitoring.
- Java 21+ → NUMA-aware GC and Project Lilliput improve memory footprint efficiency.
Best Practices
- Use direct memory for large, long-lived buffers.
- Avoid excessive allocation/deallocation.
- Set
-XX:MaxDirectMemorySizeexplicitly in production. - Use pooled buffers (e.g., Netty’s
ByteBuf) instead of allocating frequently. - Monitor native memory with JFR/JMC.
Conclusion & Key Takeaways
- Direct memory provides off-heap allocation for performance-critical applications.
- Reduces GC pressure but requires careful tuning.
- Common in frameworks like Netty, Kafka, Cassandra, and Spark.
- Must monitor usage to avoid
OutOfMemoryError: Direct buffer memory.
FAQs
1. What is the JVM memory model and why does it matter?
It defines how threads and memory interact, ensuring correctness and efficiency.
2. How does G1 GC differ from CMS?
G1 is region-based with predictable pauses, CMS was prone to fragmentation.
3. When should I use ZGC or Shenandoah?
When applications demand extremely low GC pause times.
4. What are JVM safepoints?
Points where threads pause for GC or optimization tasks.
5. How do I solve OutOfMemoryError: Direct buffer memory?
Increase -XX:MaxDirectMemorySize, use buffer pools, and monitor allocations.
6. How does JIT compilation interact with direct memory?
JIT optimizations reduce overhead when accessing off-heap buffers.
7. Can direct memory leak?
Yes, if references are held unnecessarily, preventing GC cleanup.
8. How do I monitor direct memory usage?
Use jcmd VM.native_memory, JFR, or JMC.
9. What’s new in Java 21 for memory?
NUMA-aware GC and Lilliput improve native memory footprint.
10. How does GC differ in microservices vs monoliths?
Microservices need quick startup and predictable latency, monoliths optimize for throughput.
