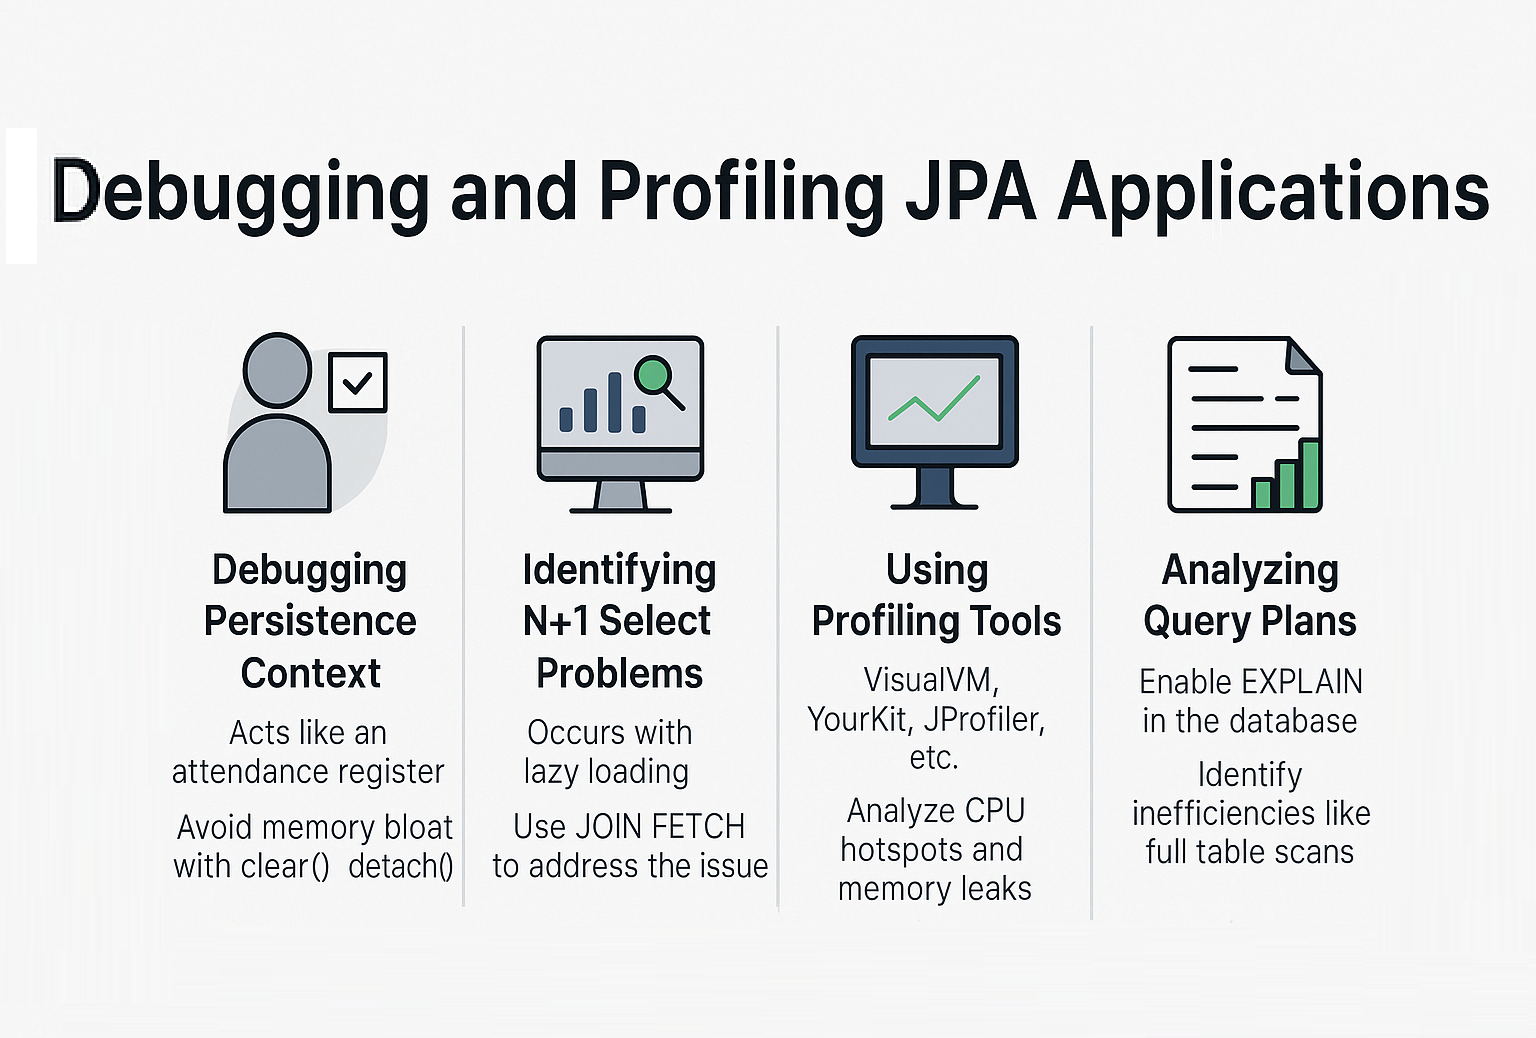
JPA (Jakarta Persistence API) simplifies persistence in Java applications, but hidden inefficiencies like N+1 queries, unoptimized joins, or improper caching can lead to performance bottlenecks. Debugging and profiling JPA applications is crucial to ensure correctness, stability, and scalability.
Think of debugging JPA like checking pipes in a plumbing system—you may not see the leaks at first, but with the right tools and techniques, you can identify and fix them before they cause major damage.
This tutorial explores effective debugging and profiling techniques for JPA applications, with practical examples and best practices.
Enabling SQL Logging
Hibernate (Most Common JPA Provider)
In persistence.xml:
<property name="hibernate.show_sql" value="true"/>
<property name="hibernate.format_sql" value="true"/>
<property name="hibernate.use_sql_comments" value="true"/>
Or in Spring Boot (application.properties):
spring.jpa.show-sql=true
spring.jpa.properties.hibernate.format_sql=true
spring.jpa.properties.hibernate.use_sql_comments=true
logging.level.org.hibernate.SQL=DEBUG
logging.level.org.hibernate.type.descriptor.sql=TRACE
This logs executed queries and parameter values.
Debugging Persistence Context
Persistence Context acts like a classroom attendance register—it tracks managed entities. Mismanagement leads to memory leaks or inconsistent states.
Useful Techniques
- Use
em.contains(entity)to check if an entity is managed. - Call
em.clear()in batch jobs to avoid memory bloat. - Use
em.detach(entity)to exclude objects from persistence context.
if (em.contains(order)) {
    em.detach(order); // Order is no longer tracked
}
Identifying N+1 Select Problems
Example
List<Department> departments = em.createQuery("SELECT d FROM Department d", Department.class)
    .getResultList();

for (Department d : departments) {
    System.out.println(d.getEmployees().size()); // triggers N+1 queries!
}
Solution with JOIN FETCH:
List<Department> departments = em.createQuery(
    "SELECT d FROM Department d JOIN FETCH d.employees", Department.class)
    .getResultList();
Using Profiling Tools
Popular Profiling Tools
- VisualVM: Free, bundled with JDK.
- YourKit: Commercial, powerful for memory/CPU profiling.
- JProfiler: Specialized for Hibernate/JPA profiling.
Profiling Focus Areas
- CPU hotspots (slow queries, repeated operations).
- Memory leaks due to large persistence contexts.
- Thread contention in high-concurrency scenarios.
Analyzing Query Plans
Enable query plan analysis at the database level:
EXPLAIN SELECT * FROM employees WHERE department_id=1;
Check for missing indexes, full table scans, or inefficient joins.
Monitoring with Statistics (Hibernate Example)
<property name="hibernate.generate_statistics" value="true"/>
Statistics stats = em.unwrap(Session.class).getSessionFactory().getStatistics();
System.out.println("Entity fetch count: " + stats.getEntityFetchCount());
System.out.println("Query execution count: " + stats.getQueryExecutionCount());
Real-World Debugging Scenarios
- E-Commerce App: Detecting N+1 issue when fetching product + reviews.
- Banking System: Memory leaks due to long-running persistence contexts.
- Microservices: Profiling inter-service queries for high throughput.
Common Pitfalls
- Eager fetching everywhere → Loads unnecessary data.
- Ignoring slow queries → Leads to production bottlenecks.
- Relying solely on logs → Use profilers for deep insights.
- Skipping database indexes → Causes inefficient queries.
Best Practices
- Enable SQL logging in dev/test environments.
- Regularly profile with tools like JProfiler.
- Use DTO projections for heavy read queries.
- Monitor second-level cache efficiency.
- Always review query execution plans.
📌 JPA Version Notes
-
JPA 2.0
- Introduced Criteria API, Metamodel.
-
JPA 2.1
- Entity graphs and stored procedures.
-
Jakarta Persistence (EE 9/10/11)
- Namespace migration (
javax.persistence→jakarta.persistence). - Better integration with modern profiling tools.
- Namespace migration (
Conclusion & Key Takeaways
- Debugging JPA is about visibility—always know what SQL is executed.
- Profiling helps detect hidden performance bottlenecks like N+1 queries.
- Use JOIN FETCH, DTOs, and caching to improve performance.
- Regularly review statistics and query plans for healthy applications.
FAQ
Q1: What’s the difference between JPA and Hibernate?
A: JPA is a specification, Hibernate is an implementation.
Q2: How does JPA handle the persistence context?
A: Like a register, it tracks managed entities in memory.
Q3: What are the drawbacks of eager fetching in JPA?
A: Loads unnecessary data, slowing down queries.
Q4: How can I solve the N+1 select problem with JPA?
A: Use JOIN FETCH, entity graphs, or batch fetching.
Q5: Can I use JPA without Hibernate?
A: Yes, with EclipseLink or OpenJPA.
Q6: What’s the best strategy for inheritance mapping in JPA?
A: SINGLE_TABLE for speed, JOINED for normalization.
Q7: How does JPA handle composite keys?
A: With @EmbeddedId or @IdClass.
Q8: What changes with Jakarta Persistence?
A: Package migration and better alignment with Jakarta EE runtimes.
Q9: Is JPA suitable for microservices?
A: Yes, if used with DTOs, caching, and event-driven communication.
Q10: When should I avoid using JPA?
A: For analytics-heavy workloads or high-throughput batch processing.
